The Launch Spike Hit. The App Fell Over. Three Weeks Later, It Held 1,000+ Concurrent Users.
N+1 queries, memory leaks, missing indexes, and zero caching: the classic AI-generated performance profile, profiled and fixed, then proven with load tests.
Written by Shubham(opens in new tab), Founder at BestlaTech · Published June 11, 2026
Engagement Type
AI Code Rescue: Performance
Duration
3 Weeks
Client
Consumer App Startup
Client
Consumer App Startup
Duration
3 weeks
Category
AI Code Rescue / Performance
Client's Markets
US
Faster Responses
10x
Measured before and after, same endpoints
Concurrent Users
1,000+
Verified with k6 load tests, not hope
Crashes Since Release
0
Memory leaks eliminated, monitoring in place
Profiling to Proven
3 wks
Fixed scope, fixed price
Key Facts
BestlaTech rescued an AI-generated consumer app that crashed under real traffic, profiling the bottlenecks, eliminating N+1 queries, fixing memory leaks, adding Redis caching and proper indexes, and proving the result with k6 load tests: 10x faster responses, stable at 1,000+ concurrent users.
Client:
A consumer app startup with an AI-generated codebaseWhat was done:
Performance profiling, N+1 query elimination, memory leak fixes, Redis caching, database indexing, and load-test verificationTimeline:
3 weeks, profiling to load-tested production releaseEngagement model:
Fixed scope, fixed priceResult:
10x faster responses; stable at 1,000+ concurrent users under load test; monitoring and alerting left in placeThe Challenge
Demo-Quality, Not Production-Quality
Every feature worked with 10 users. At 50, response times climbed. At the launch spike, cascading timeouts took the whole app down.
The Classic AI-Generated Profile
N+1 queries in loops, zero caching, missing indexes, unbounded memory growth. Functionally correct code that no one had ever asked a performance question about.
Crashing in Front of New Users
The outages hit during marketing pushes: exactly when the most first-time users were forming their one and only impression of the product.
Profile First. Fix What the Profiler Proves. Verify with Load, Not Hope.
Performance rescue done badly is guesswork, rewriting things that feel slow. We measure first, fix the proven bottlenecks in impact order, and don't call anything done until a load test says so.
Measure Before Touching Code
Profiling and query analysis under simulated load identified exactly where the time and memory went. The fix list came from the profiler, not from intuition.
Fix the Data Layer First
N+1 query patterns collapsed into batched queries, and missing indexes added where the query planner showed full-table scans. The data layer is where most of the 10x came from.
Cache Where Measurements Justify It
Redis caching added for the hot read paths the profiler identified, not sprayed everywhere. Cache invalidation is a cost; we only pay it where it buys real latency.
Prove It with Load Tests, Then Leave Monitoring
k6 load tests verified stability at 1,000+ concurrent users before release, and the monitoring and alerting we left behind means the next bottleneck gets seen before users feel it.
Technologies Used
Key Features
Performance profiling under simulated load. CPU, memory, and query analysis
N+1 query elimination: looped queries collapsed into batched fetches
Database indexing driven by query-planner evidence
Redis caching on measured hot read paths
Memory leak diagnosis and elimination
k6 load-test suite covering launch-spike scenarios
Production monitoring and alerting left in place at handover
Results & Impact
Response times improved 10x on the same endpoints, measured before and after
Stable at 1,000+ concurrent users, verified with k6 load tests before release
Memory leaks eliminated: no crashes since release
Database load reduced dramatically through batched queries and proper indexes
Launch-spike scenario load tests now part of the team's release process
Delivered in 3 weeks on fixed scope, fixed price
The next marketing push was the real test: traffic spiked, the app didn't blink, and the team watched dashboards instead of fighting fires. The product AI helped them build fast is now built to survive being popular.
Before vs After
| Before | After | |
|---|---|---|
| Stability | Crashed during traffic spikes | Stable at 1,000+ concurrent users |
| Response times | Seconds, degrading with load | 10x faster, flat under load |
| Database queries | N+1 loops, full-table scans | Batched queries, indexed lookups |
| Memory | Grew until the process died | Flat: leaks eliminated |
| Verification | Hope | k6 load tests in the release process |
If Your App Works Until People Actually Use It, This Is Solvable.
AI-generated codebases fail under load in predictable ways, which means they're fixable in predictable ways. Profiling finds the bottlenecks in days; the fixes are usually concentrated in a handful of places.
Startups That Just Hit Real Traffic
Your AI-built MVP found users and immediately found its limits. The N+1s, missing indexes, and absent caching are days of expert work, not a rewrite.
Teams with a Launch Coming
You know a spike is coming and you don't know if the app will hold. A load test tells you in days, and gives you the fix list if it won't.
Products That Got Slow as They Grew
Not AI-generated, just aging: same playbook. Profile, fix the proven bottlenecks, verify under load, leave monitoring behind.
Find Out If Your App Survives Its Next Spike. Before the Spike Does.
Book a call and we'll scope a performance assessment: profiling, a load test against your real traffic pattern, and a fixed-price fix list ranked by impact.
Book Your Free Discovery Call (opens in new tab)Fixed scope. Fixed price. Zero surprises.
Frequently asked questions
Why do AI-generated apps fail under load?
How do you find the bottlenecks?
Do we need a rewrite?
How do we know it will hold up next time?
How long does a performance rescue take?
Who can fix an app that crashes or slows down under load?
Why do AI-generated apps fall over when real traffic arrives?
How do you find a performance bottleneck instead of guessing?
How do we know the performance fix will hold next time traffic spikes?
Talk to an expert
Get expert advice from our official advisors
More of Our Case Studies
Explore our diverse portfolio of successful projects and innovative case studies that showcase our expertise in delivering top-notch solutions.
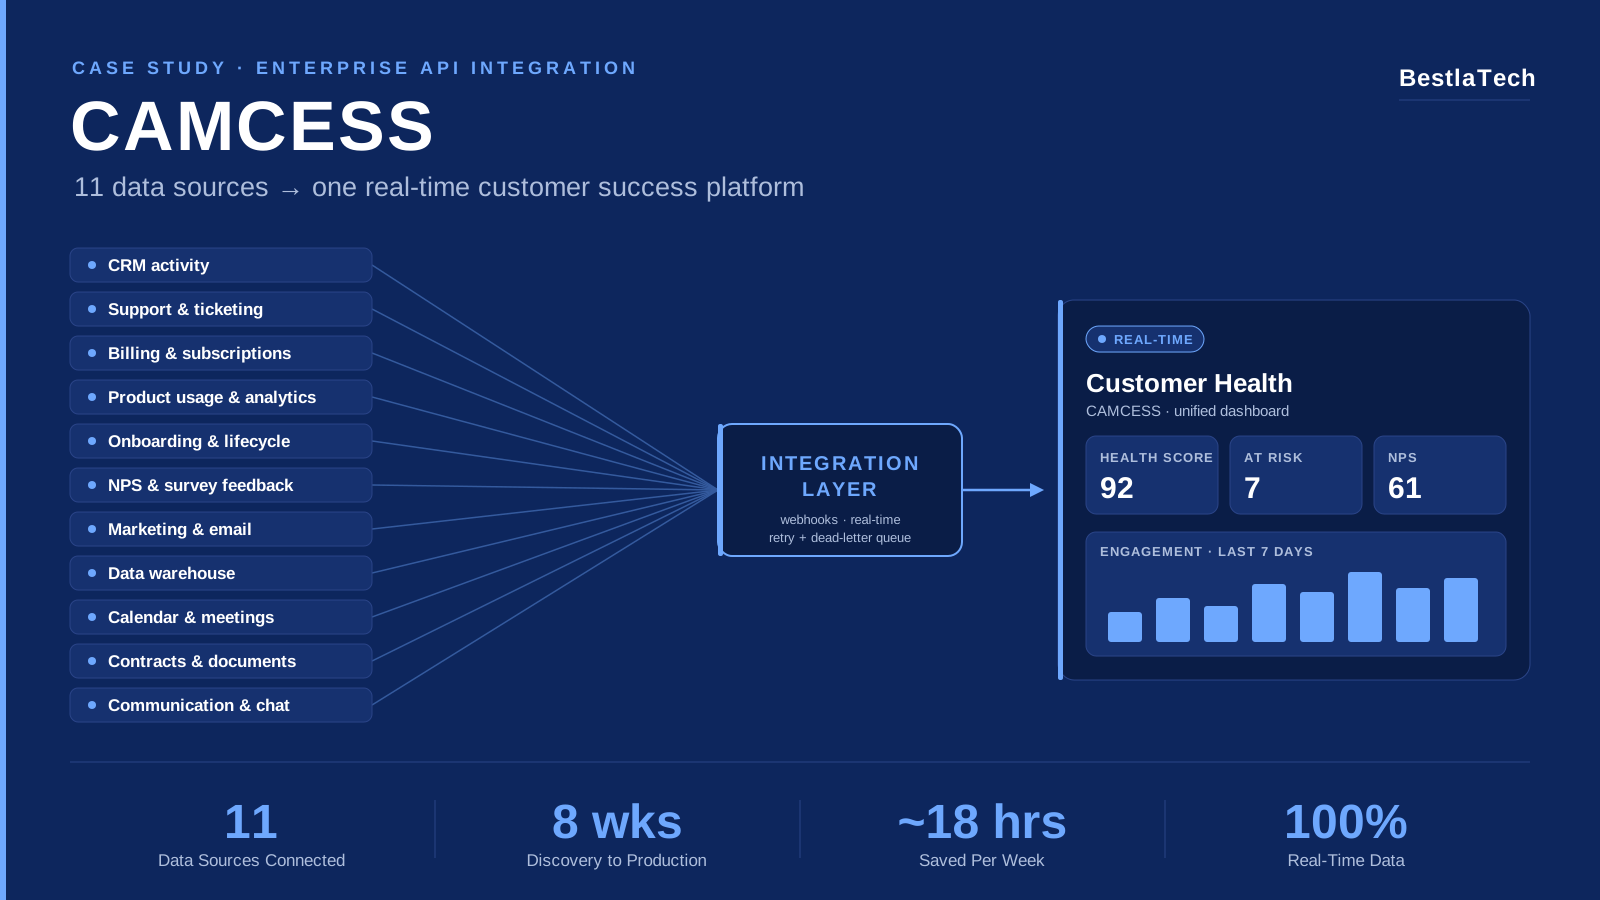
Customer Success SaaS
CAMCESS: How BestlaTech Connected 11 Data Sources into a Real-Time Customer Success Platform
End-to-end enterprise API integration for a B2B customer success SaaS, connecting 11 siloed data sources into a single real-time customer health dashboard, replacing weekly manual reconciliation entirely.
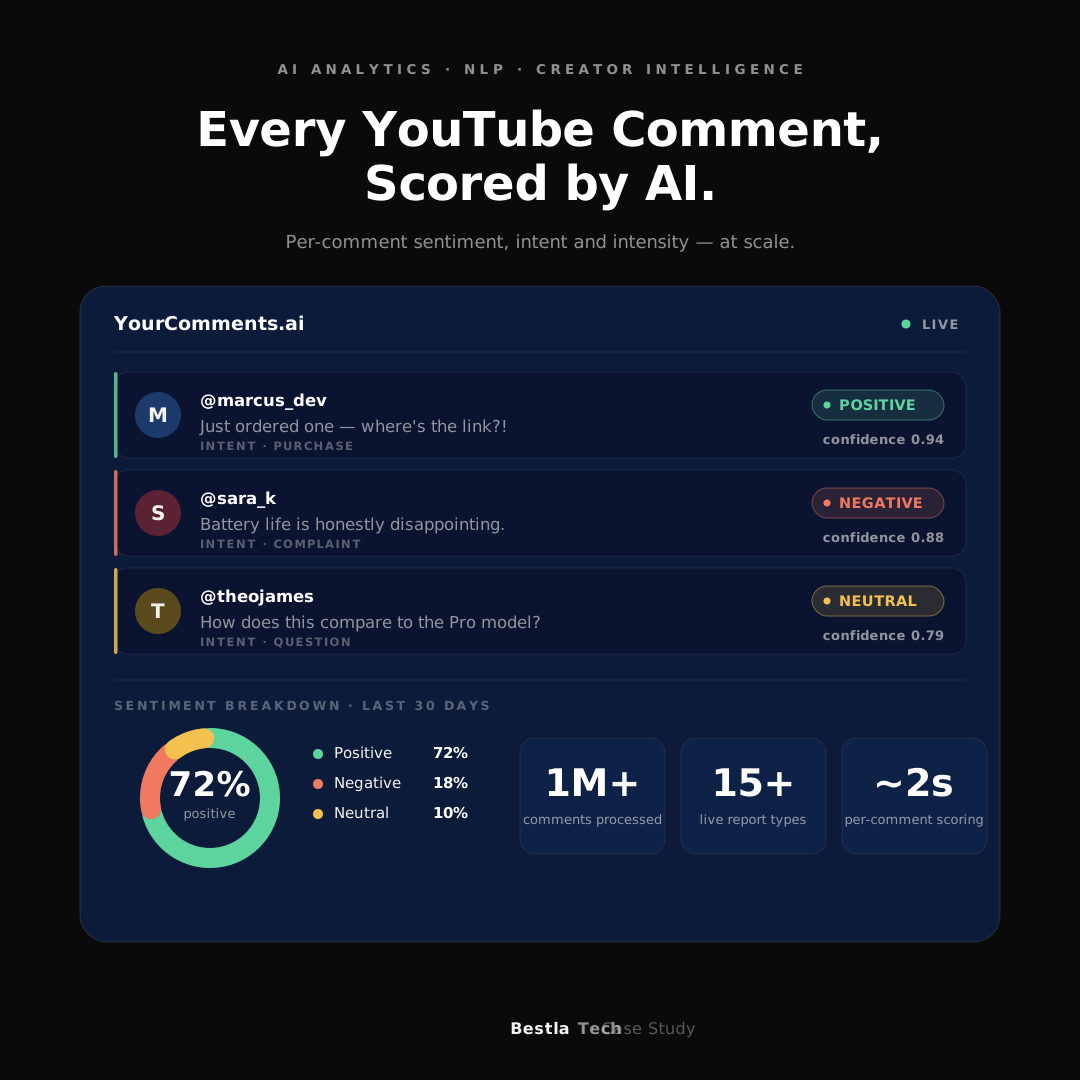
AI Analytics · NLP · Creator Intelligence
YourComments.ai: How BestlaTech Built a YouTube Comment Sentiment Analysis Platform from the Ground Up
Full-stack AI analytics platform built from scratch: fetching YouTube comments at scale, running per-comment sentiment analysis via OpenAI, streaming results through an NDJSON pipeline, and delivering creator and brand intelligence through live Metabase dashboards.
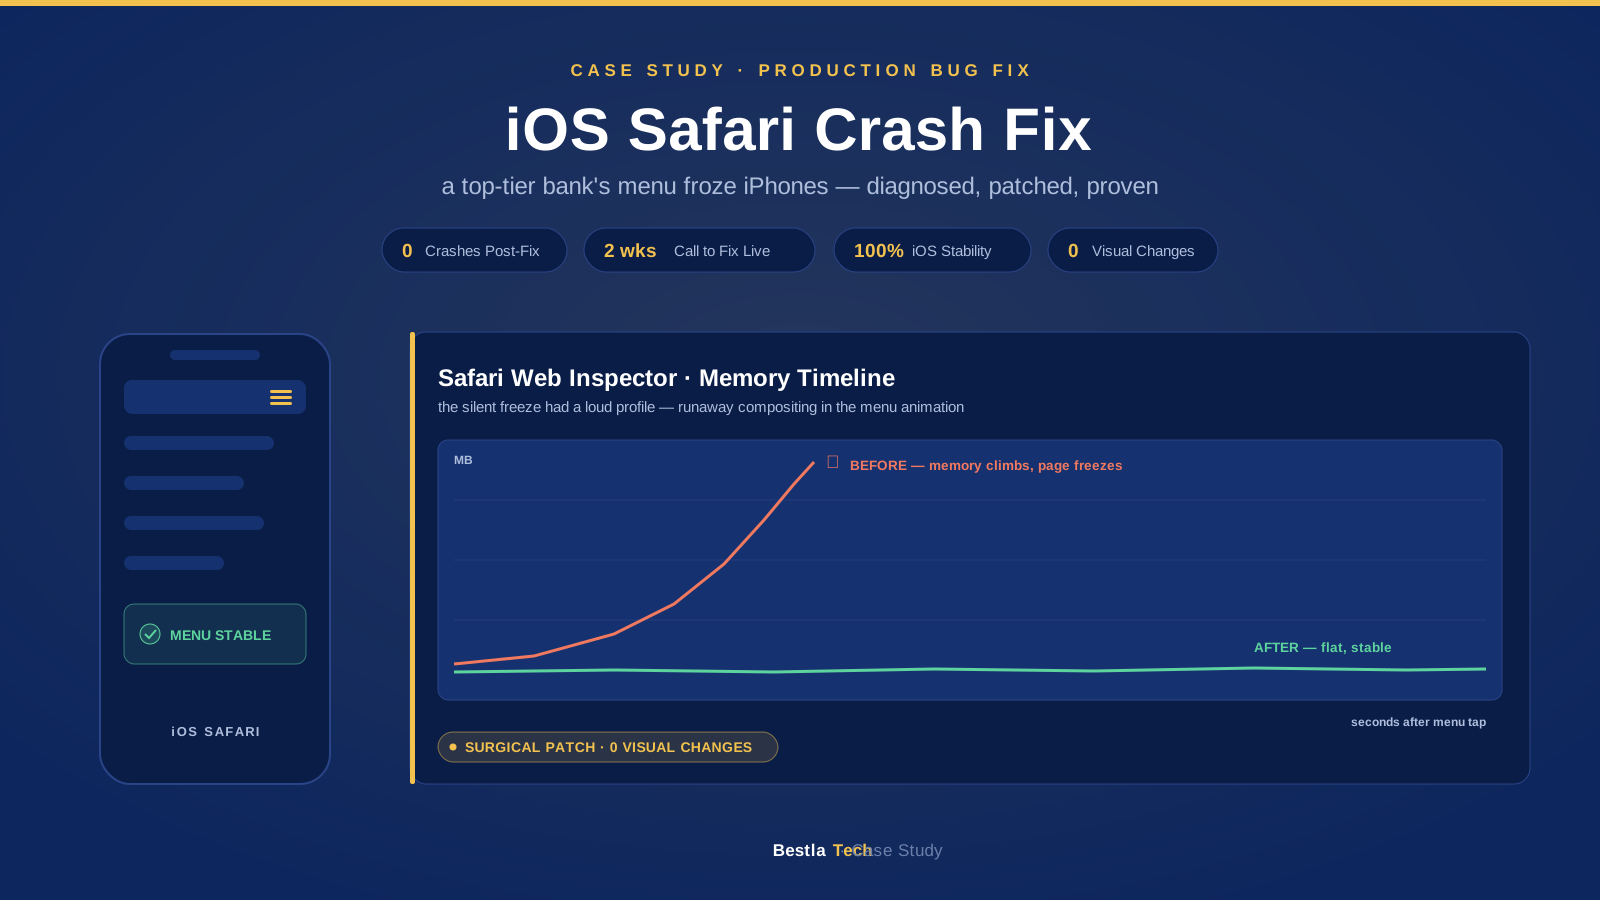
Mobile Web / Performance & Debugging
Diagnosing and Fixing an iOS Safari Navigation Crash on a Top-Tier Indian Bank's High-Traffic Website
Production incident engagement for a top-tier Indian private bank: the website's hamburger menu froze iPhones within seconds of a tap. Root cause diagnosed, patched, and verified across iOS versions in 2 weeks.
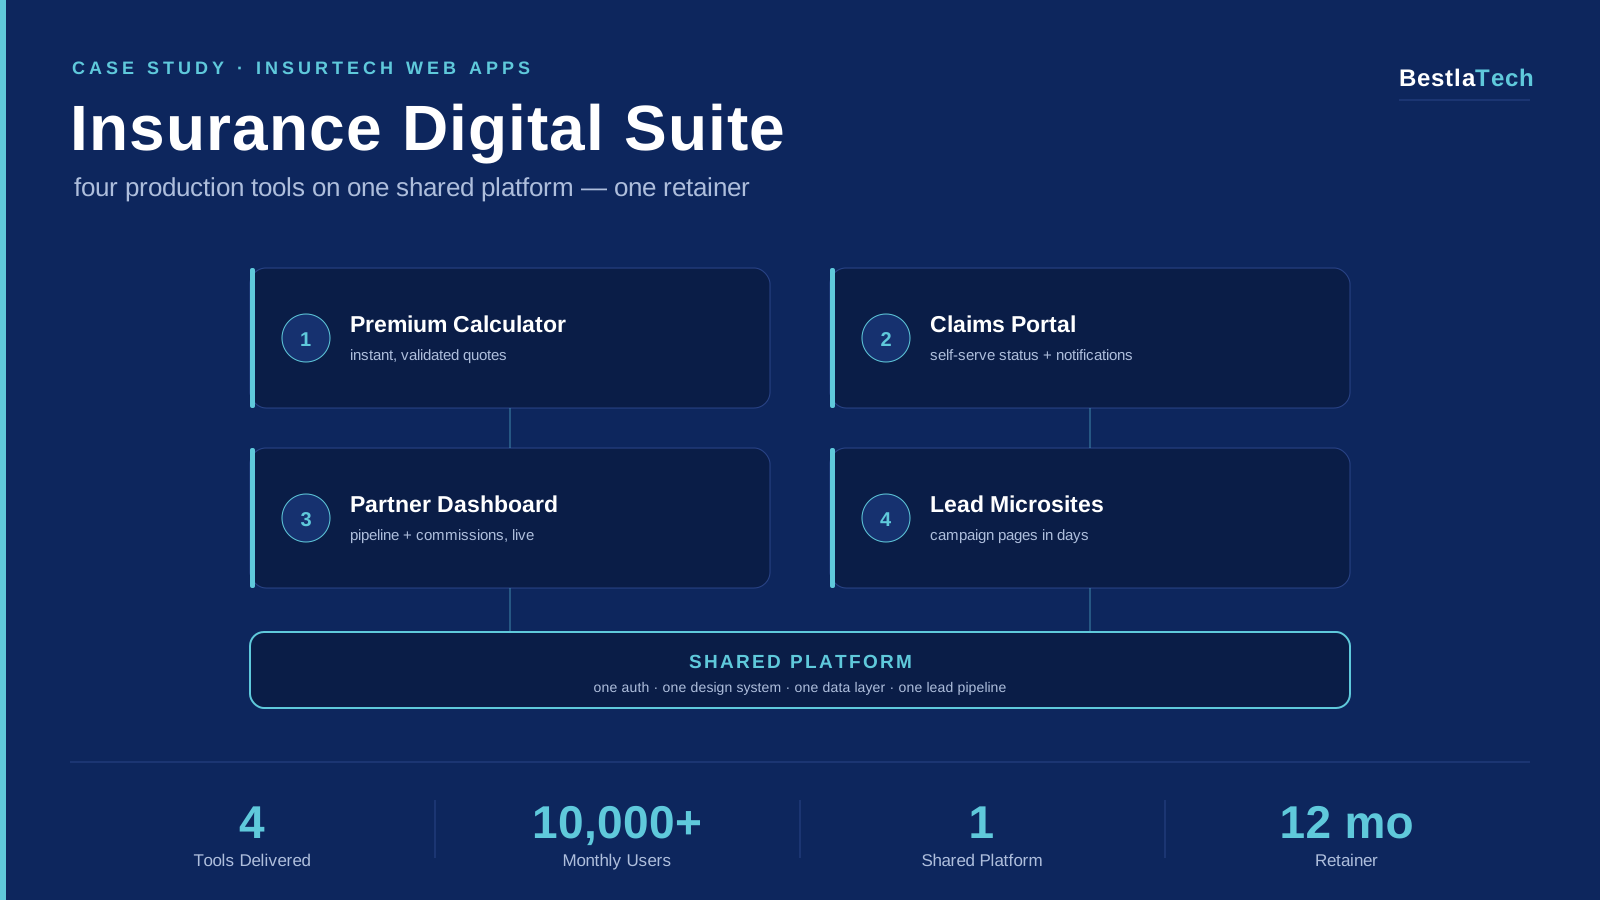
InsurTech / Web App Development
A Multi-Project Digital Suite for an Indian Insurance Broker: Premium Calculator, Claims Portal, Partner Dashboard & Lead Microsites
Multi-project engineering retainer for an Indian insurance broker: four tools delivered on one shared platform: an accurate premium calculator, a self-serve claims tracking portal, a partner/agent dashboard, and campaign lead microsites, now serving 10,000+ monthly users.
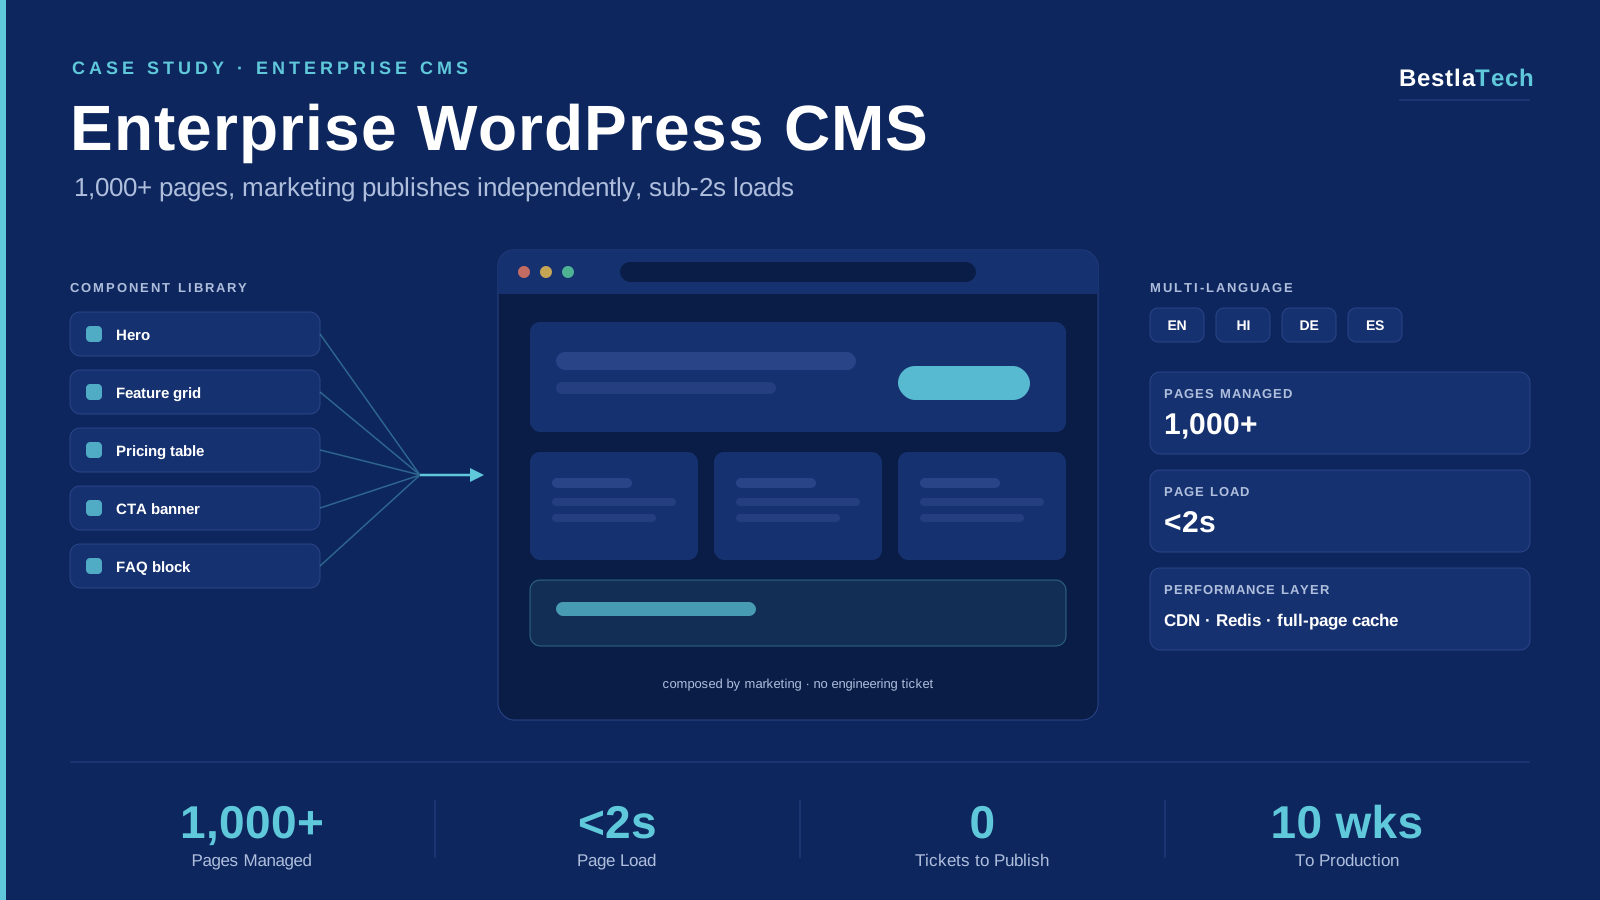
CMS Development / WordPress / Enterprise
An Enterprise WordPress CMS for a Leading CPaaS Company: 1,000+ Pages, Independent Publishing, Sub-2s Loads
Enterprise CMS build for a leading CPaaS company: a custom component-based WordPress theme, structured content architecture, and multi-language support that lets the marketing team publish independently at 1,000+ page scale with sub-2-second loads.
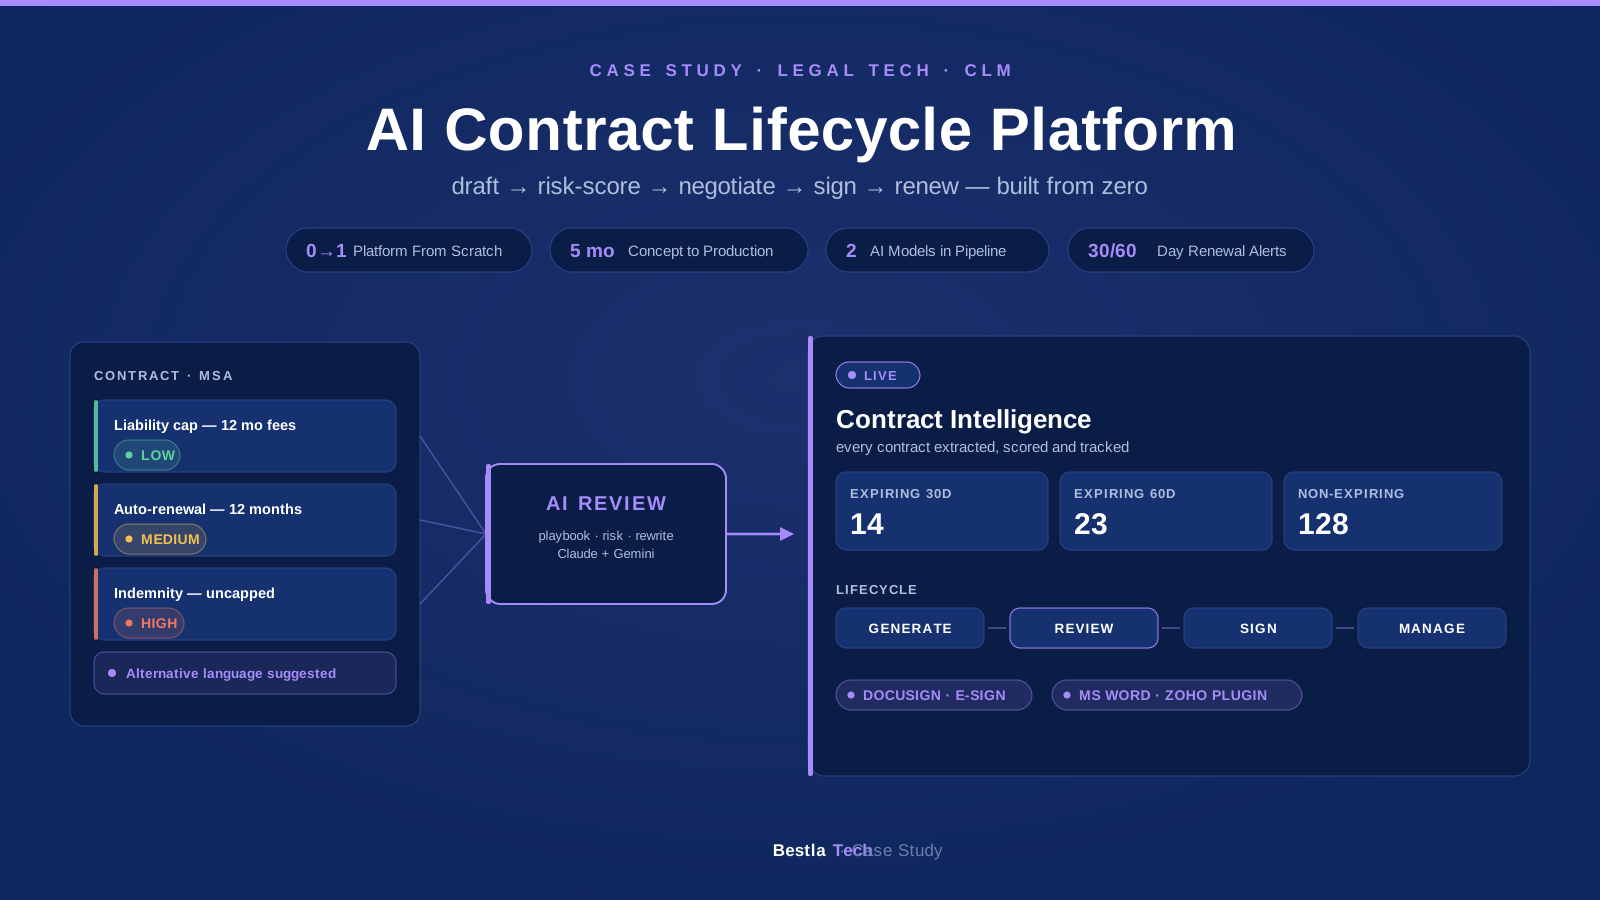
Legal Tech / CLM / AI Platform
Building an AI-Powered CLM Platform from Zero: Contract Generation, Clause Risk Scoring, Playbooks, E-Signature & Renewals
Full CLM (Contract Lifecycle Management) platform built from scratch for a legal-tech SaaS company (client name withheld). AI contract generation, metadata extraction and characterization, clause-by-clause risk scoring with suggested alternative language, playbook-driven review, 30/60-day renewal categorization, DocuSign e-signature, and Microsoft Word integration via a Zoho plugin.
Travel & Tourism
Building a Complete Digital Presence for Travel With Bug Travel Company
End-to-end digital transformation for a travel agency - professional responsive travel website development with WordPress CMS, online booking system, tour package management, and SEO optimization for organic lead generation.
On-Demand Services
Full-Stack Mobile App and Web Development for Mechgiri On-Demand Auto Service Platform
Custom mobile app development and web application for on-demand vehicle servicing - featuring real-time tracking, technician management, automated booking system, secure payment gateway integration, and cross-platform admin dashboard.
E-Commerce
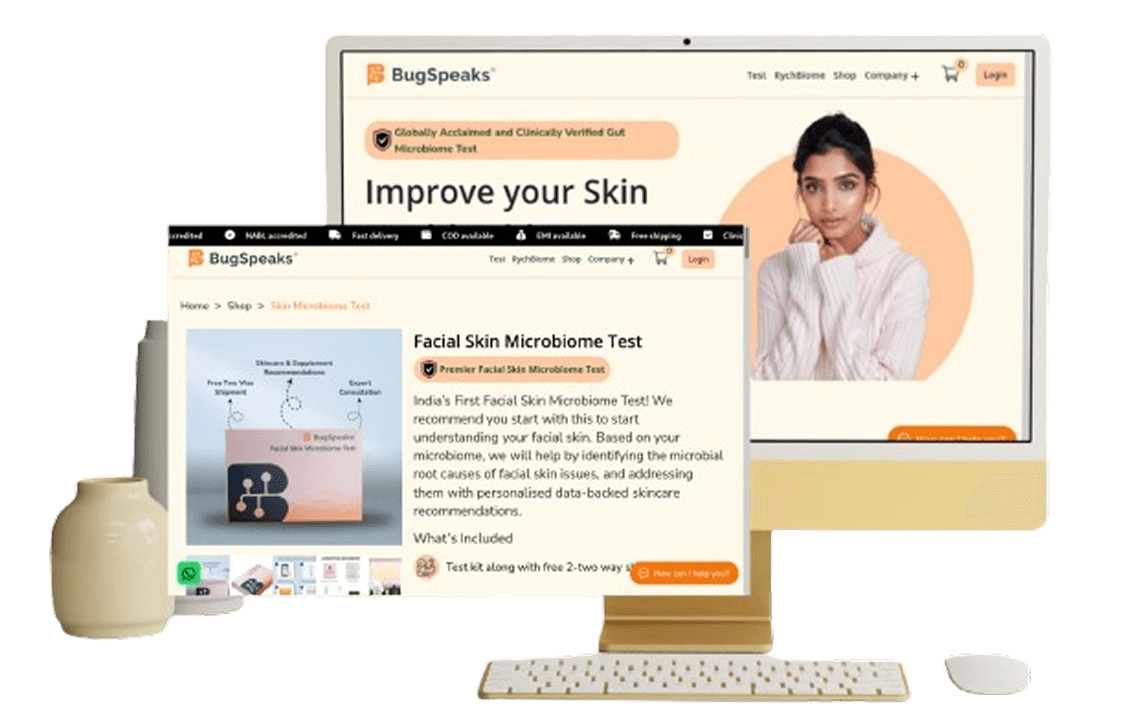
Custom E-Commerce Website Development for BugSpeaks Gut Health Brand
Complete digital transformation from offline to online business - custom e-commerce platform development with Django, automated inventory management, secure payment integration, order tracking system, and scalable cloud infrastructure for health and wellness products.
Agritech / Smart Farming
Redesign and Performance Optimization for Letcetra Agritech
Complete frontend modernization for smart agriculture platform - Next.js development with server-side rendering, React component architecture, mobile-first responsive design, advanced SEO optimization, and performance enhancement for agritech industry leader.
FinTech / Financial Operations
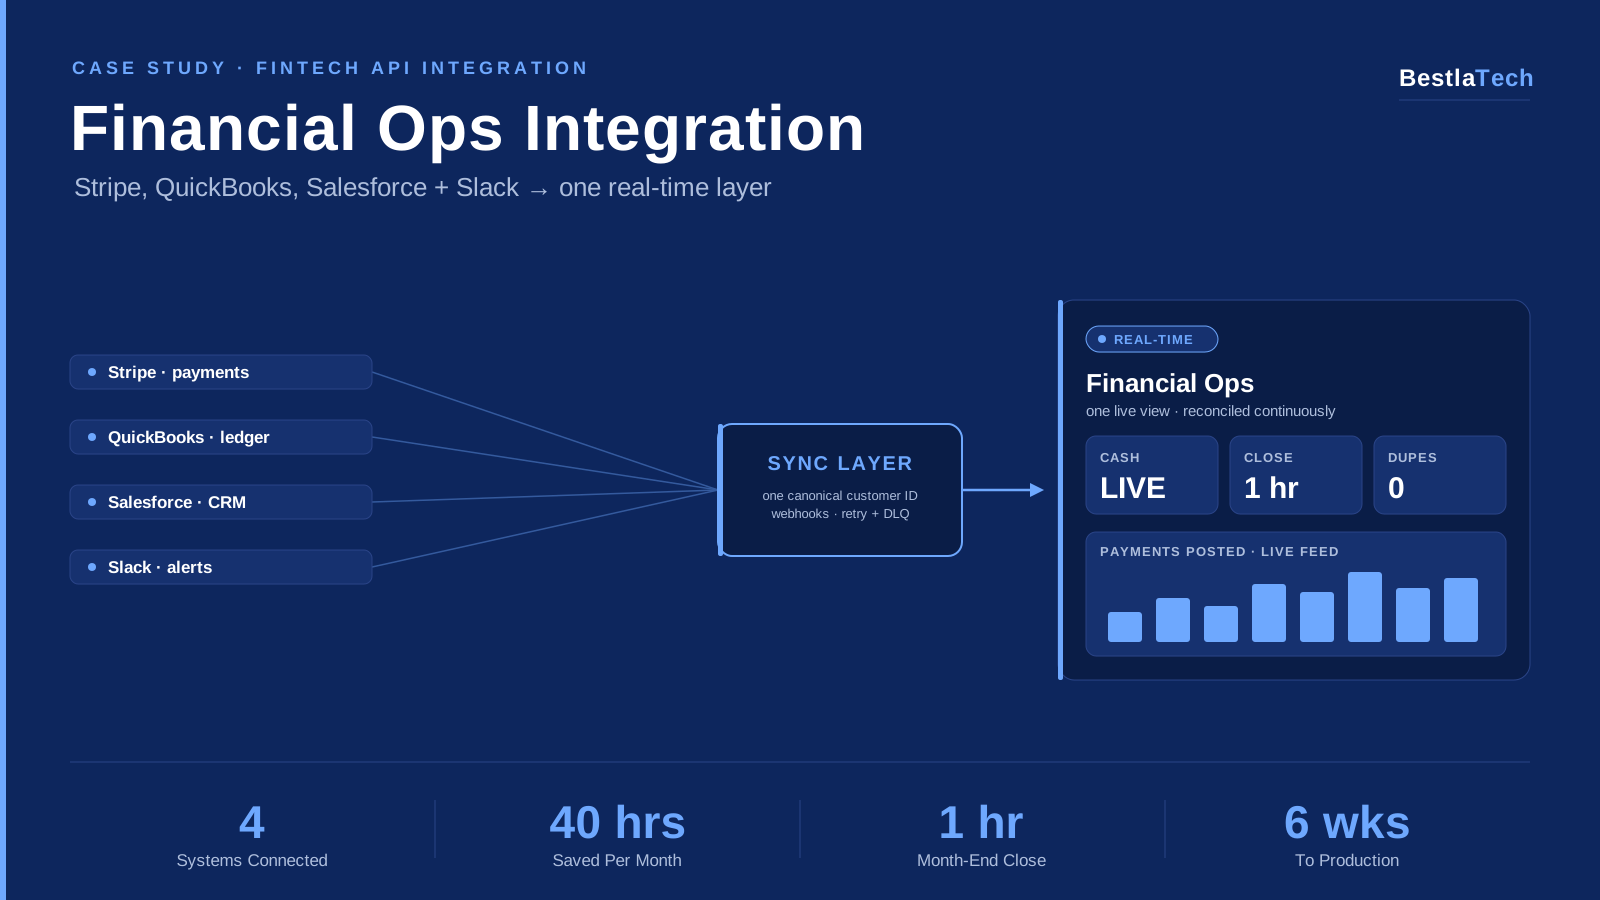
How a US FinTech SaaS Unified Stripe, QuickBooks, Salesforce & Slack into One Real-Time Financial Ops Layer
Multi-system API integration for a venture-backed US fintech SaaS. Stripe, QuickBooks, Salesforce, and Slack connected into one real-time financial operations layer, cutting the month-end close from 3 days to 1 hour.
Logistics / Supply Chain
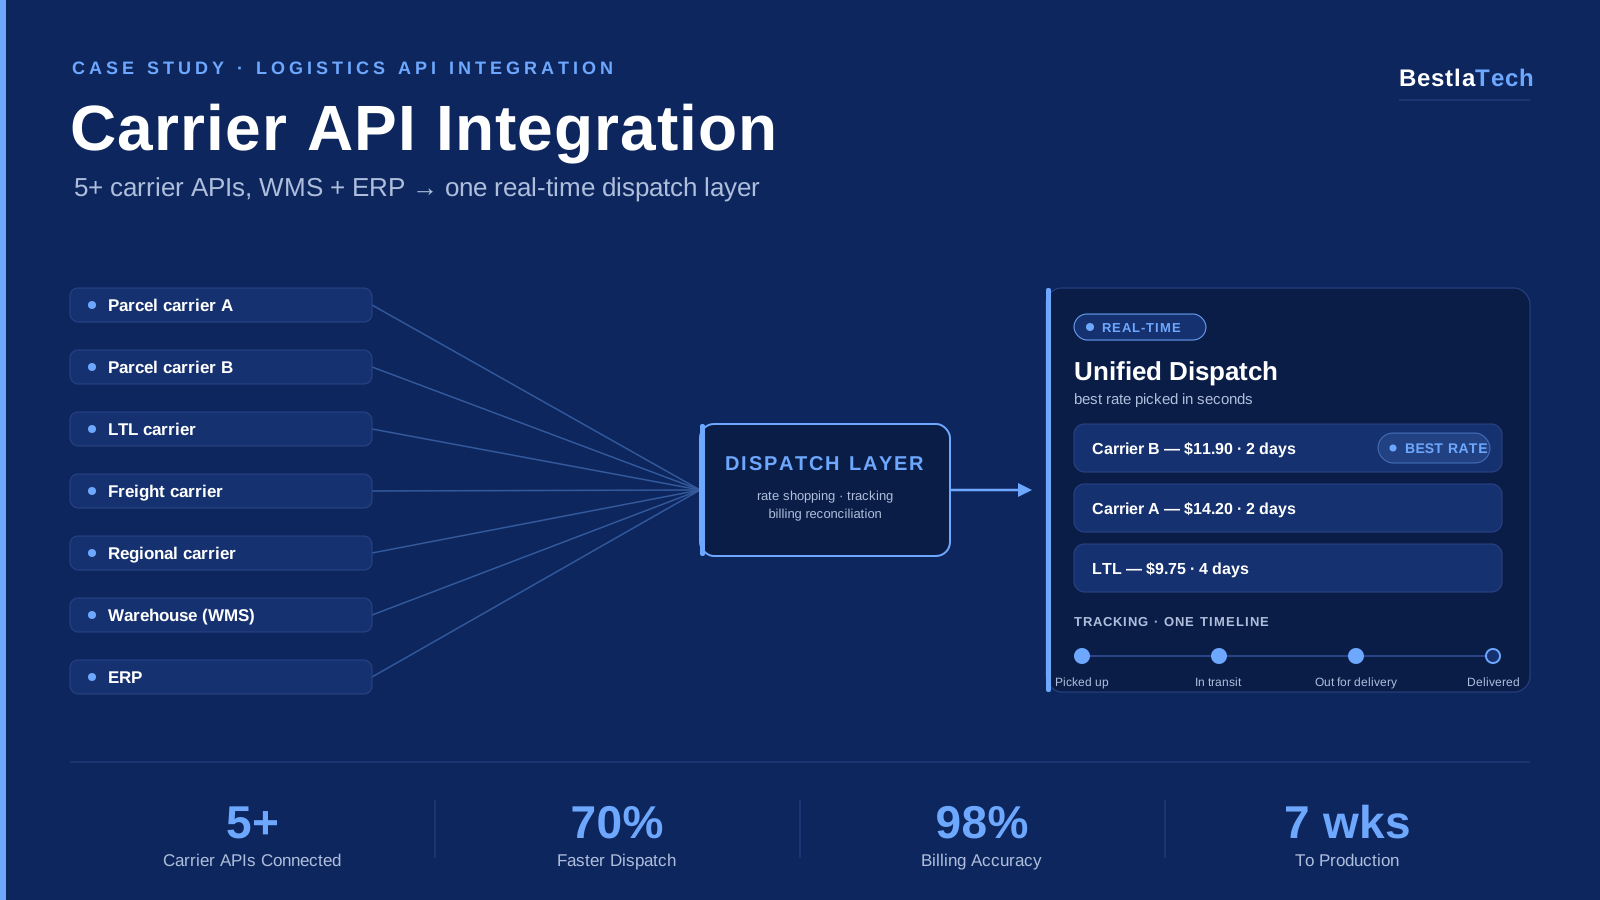
How a US Logistics Operator Unified 5+ Carrier APIs, WMS & ERP into One Real-Time Dispatch Layer
Multi-carrier API integration for a US logistics operator: parcel, LTL, and freight carrier APIs connected with the warehouse management system and ERP into one dispatch layer with automated rate shopping and unified tracking.
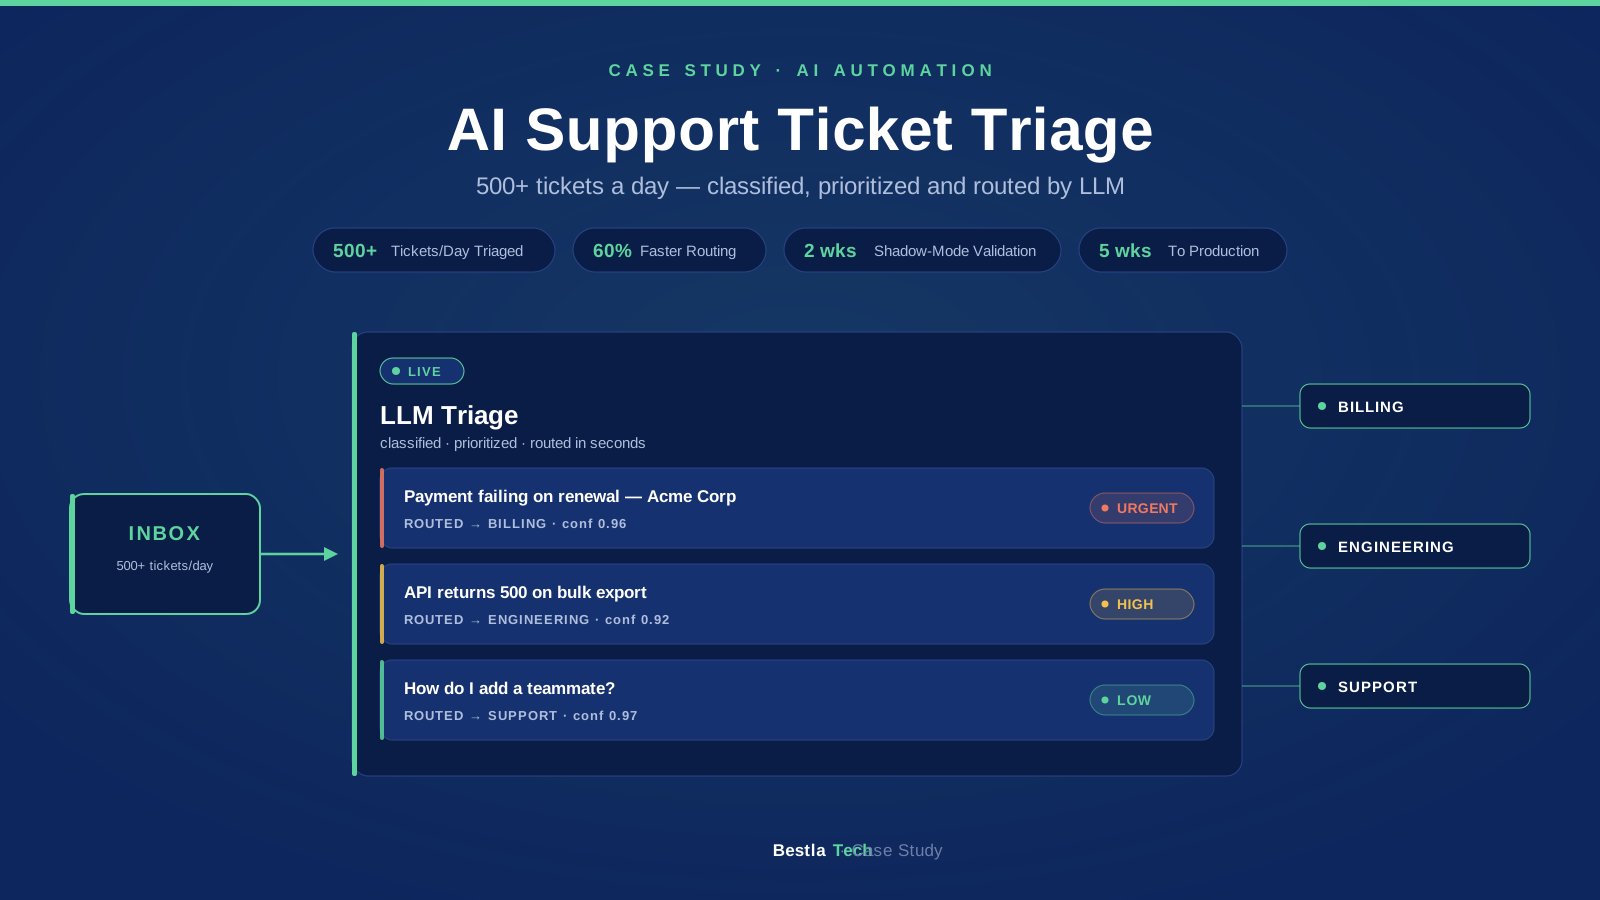
AI Automation / Customer Support
How a B2B SaaS Support Team Automated Ticket Triage with an LLM Pipeline: 500+ Tickets a Day, Routed in Seconds
LLM-powered support ticket triage for a B2B SaaS company: automatic classification, prioritization, and specialist routing of 500+ daily tickets, with confidence thresholds and human-in-the-loop review built in.
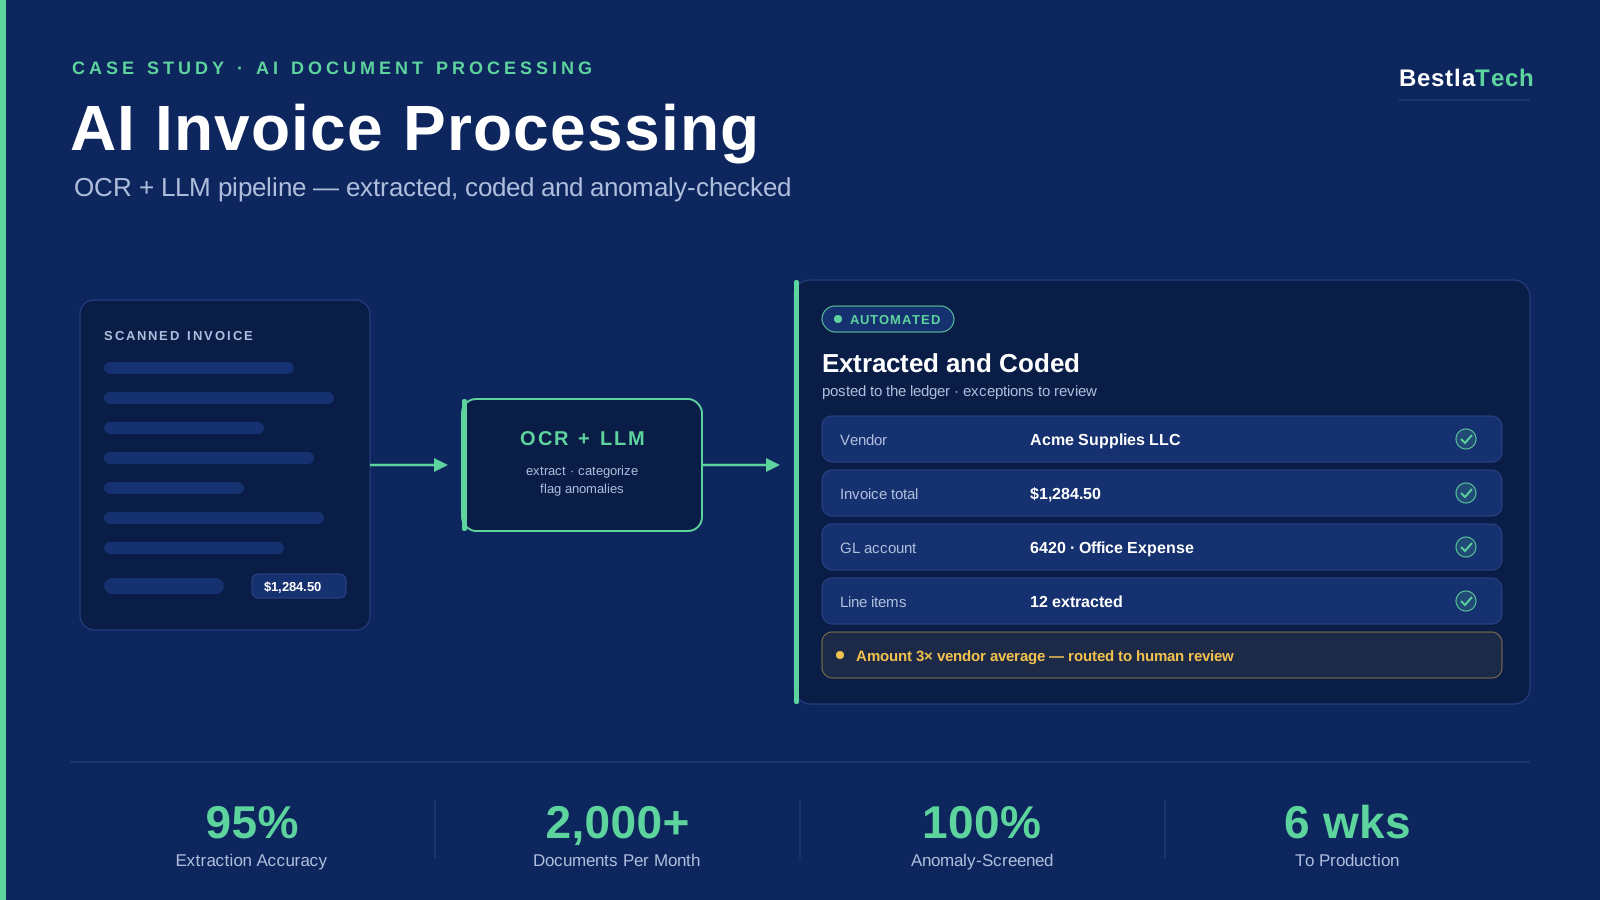
AI Automation / Accounting
How a US Accounting Firm Automated Invoice & Expense Processing with an OCR + LLM Pipeline: 2,000+ Documents a Month
AI document processing for a US accounting firm: an OCR + LLM pipeline that extracts line items from scanned invoices, auto-categorizes them to the chart of accounts, and flags anomalies, with a human review queue for low-confidence documents.
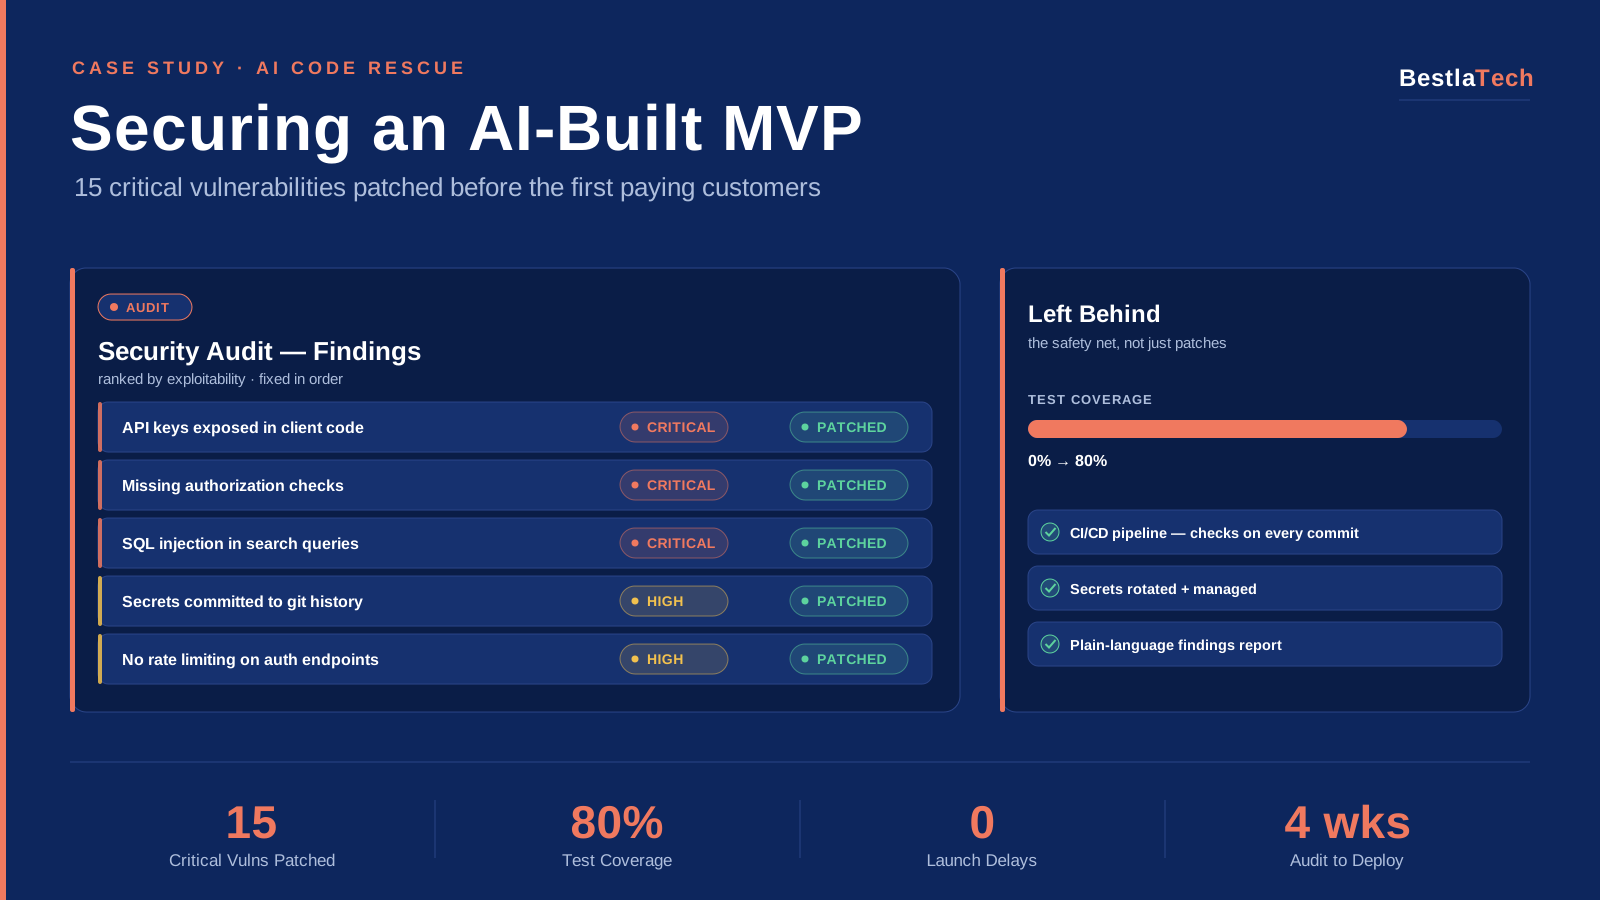
AI Code Rescue / Security
Rescuing an AI-Generated MVP: 15 Critical Vulnerabilities Patched Before the First Paying Customers Arrived
AI code rescue for a seed-stage SaaS startup: a security audit and hardening of an AI-generated MVP: 15 critical vulnerabilities patched, test coverage built from zero to 80%, and a CI/CD pipeline put in place before launch.
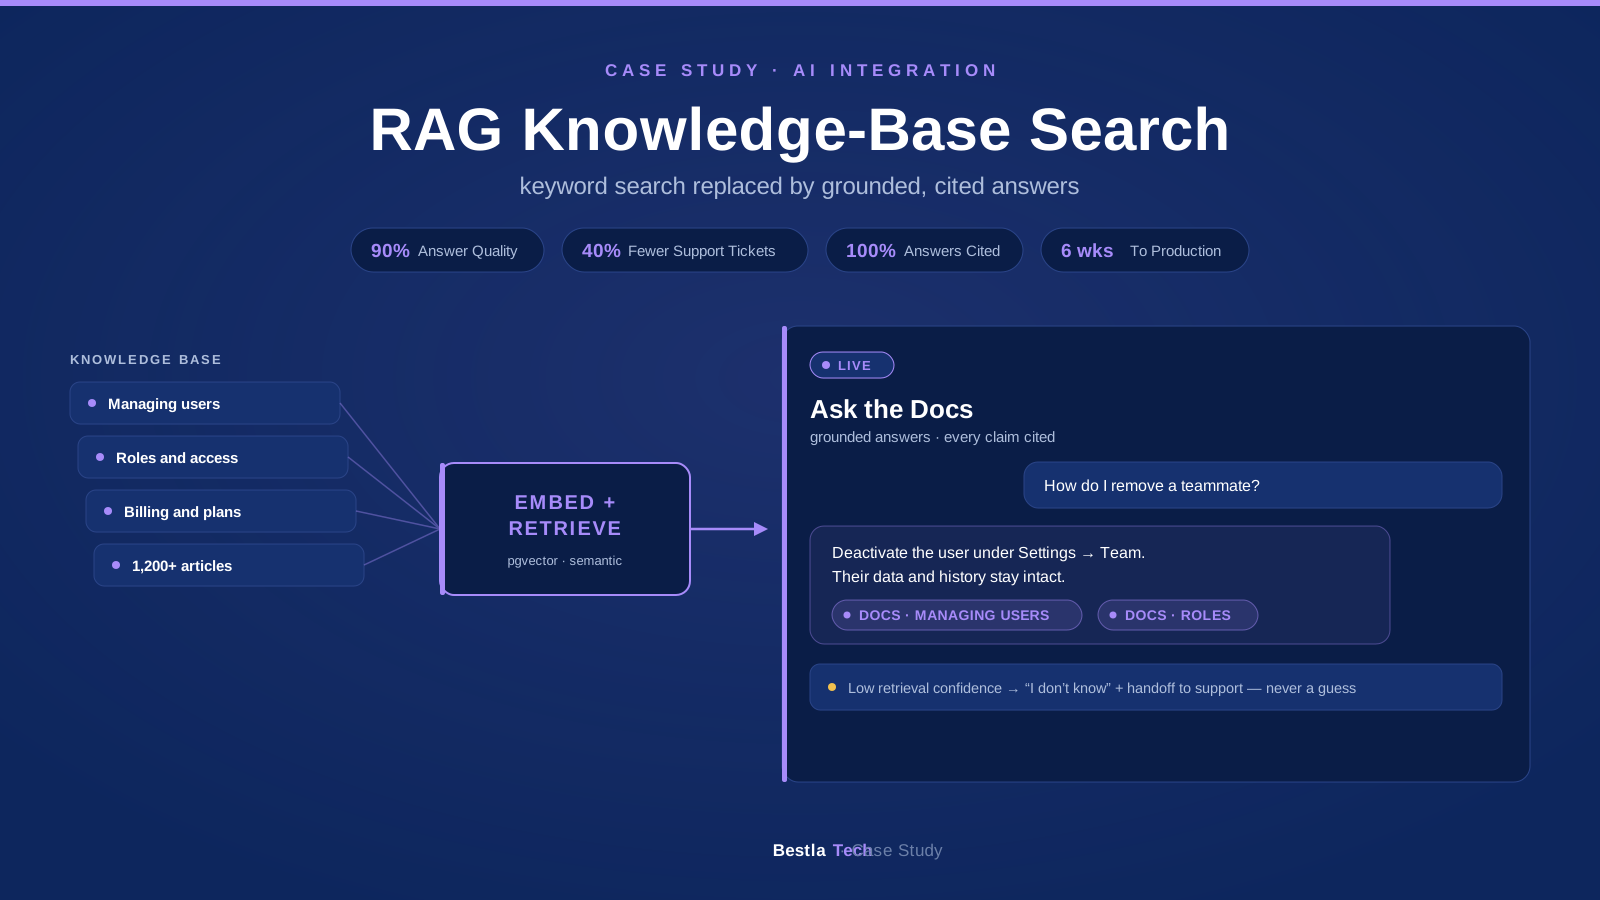
AI Integration / Knowledge Management
Replacing Keyword Search with a RAG Assistant: Grounded, Cited Answers Over a B2B Knowledge Base
RAG integration for a B2B SaaS platform. LLM-powered semantic search over the product knowledge base with grounded, cited answers, evaluated against a test set before launch. Support tickets down 40%.
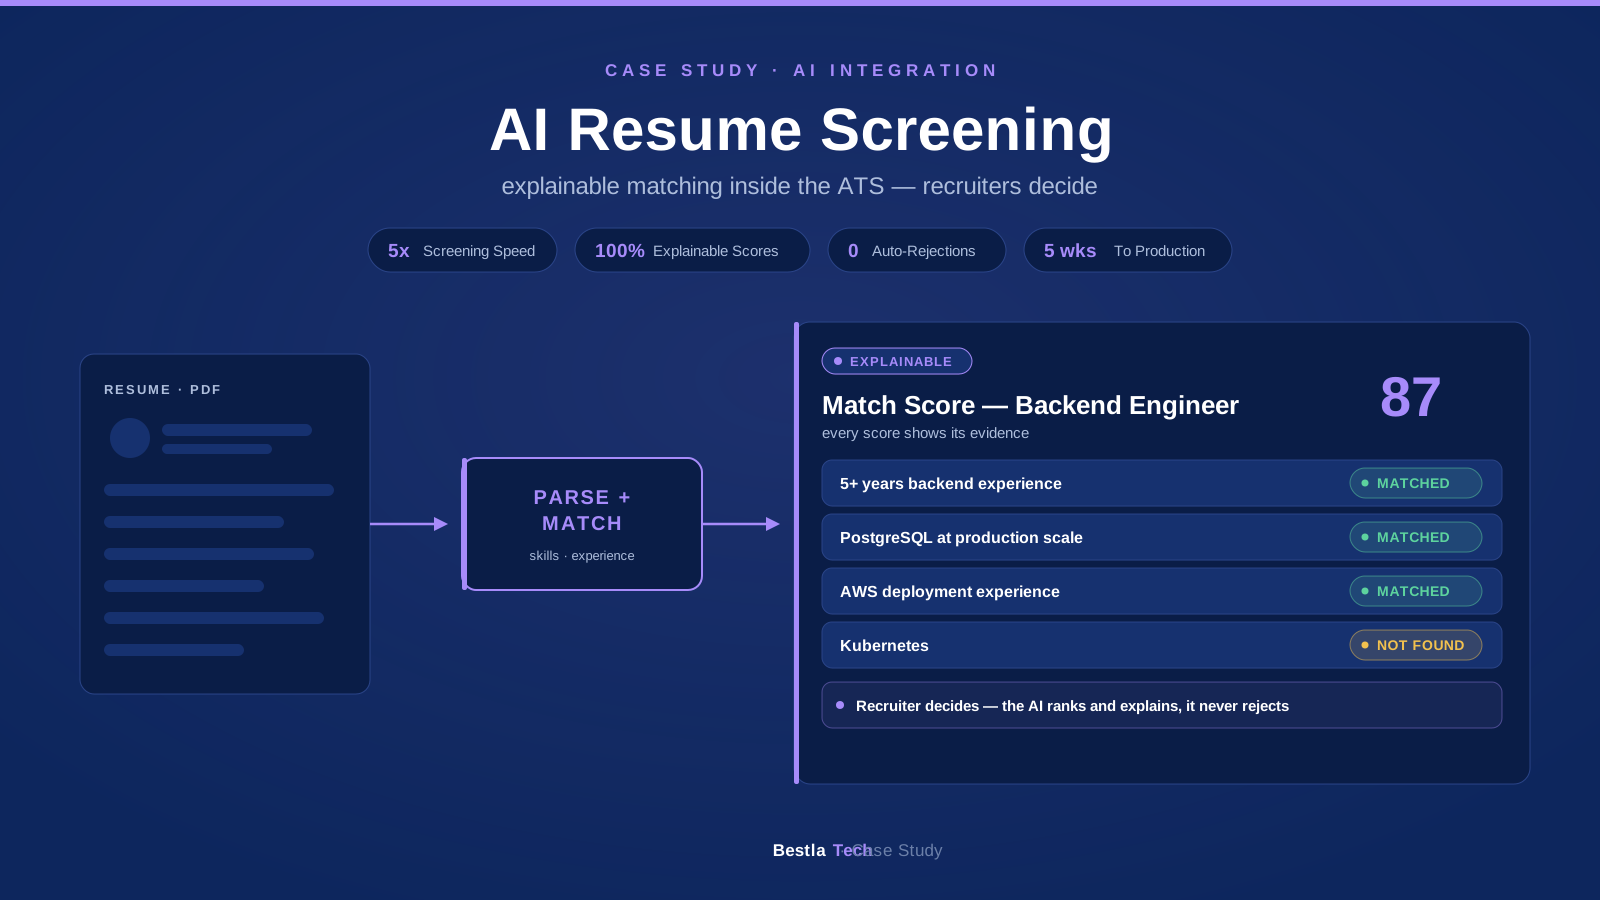
AI Integration / HR Tech
AI Resume Screening Inside an ATS: Parsing, Skill Extraction & Explainable Role Matching for an HR Tech Platform
AI integration for an HR tech platform: resume parsing, skill extraction, and explainable candidate-to-role matching built into the existing ATS workflow. Screening 5x faster, with recruiters making every decision.