How CAMCESS Went from Weekly Manual Reports to Real-Time Customer Intelligence
11 disconnected systems. One unified integration layer. Built in 8 weeks.
Written by Shubham(opens in new tab), Founder at BestlaTech · Published June 26, 2026
Engagement Type
Enterprise API Integration
Duration
8 Weeks
Scope
11-Source Data Hub + Real-Time Dashboard
Client
CAMCESS
Duration
8 weeks
Category
Customer Success SaaS
Client's Markets
US, UAE, Singapore
Data Sources Connected
11
CRM, support, billing, product usage, and seven more
Delivered in Production
8 wks
Fixed scope, fixed price: no extensions
Saved Per Week
~18 hrs
Manual reconciliation work eliminated
Real-Time Data
100%
Replaced weekly batch reports entirely
Key Facts
BestlaTech connected 11 disconnected data sources into a single real-time customer health platform for CAMCESS, a B2B customer success SaaS company, replacing a full day of weekly manual reconciliation with live data.
Client:
CAMCESS: a customer success / B2B analytics SaaS platformWhat was built:
An 11-source API integration layer feeding one real-time customer health dashboardTimeline:
8 weeks, discovery to productionEngagement model:
Fixed scope, fixed price, weekly demosClient's markets:
US, UAE, SingaporeSources connected:
11: CRM, support/ticketing, billing & subscriptions, product usage, onboarding/lifecycle, NPS & survey, marketing & email engagement, data warehouse, calendar/meeting, contract & document, and communication/chat dataResult:
Weekly manual reporting eliminated; ~18 hours/week recovered; data current within seconds of a source eventThe Challenge
Eleven Platforms, No Single View
Every customer health signal lived in a different system. Seeing the full picture required pulling eleven exports, reconciling in spreadsheets, and hoping nothing had changed by the time the report was done.
Decisions Made on Stale Data
Weekly batch reporting meant the team was always reacting to what happened last week. In a customer success context, a day-old churn signal is a missed intervention.
Brittle Automation That Failed Silently
Low-code workarounds broke under real data volume: no retry logic, no failure alerts, no audit trail. The team only knew something had gone wrong when a client report looked wrong.
Scope the Complexity First. Build Second.
Before writing a line of code, we spent the first week mapping every system CAMCESS depended on: how each API authenticated, what data it exposed, how it structured payloads, and where it was likely to fail. That audit became the foundation for a scope that covered the full problem, not just the easy parts.
Full System Audit Before Scope
Every API endpoint, authentication method, rate limit, and data schema across all 11 sources documented before a proposal was written. Edge cases identified in week one, not mid-build.
Event-Driven Architecture, Not Batch Jobs
Real-time propagation via webhooks and event-driven triggers, not scheduled jobs running every few hours. Non-negotiable for a customer success use case where delays cost accounts.
Error Handling as a First-Class Requirement
Retry logic, dead-letter queues, and failure alerting built into every integration point. If a source API goes down or returns unexpected data, the system handles it gracefully, nothing fails silently.
Weekly Demos Against Real Data
Every sprint ended with a live demo using CAMCESS's actual data, not mock payloads. The team tested real integrations each week before we moved to the next source.
Connected Data Sources
| # | Source Category | What It Feeds the Platform |
|---|---|---|
| 1 | CRM activity | Account ownership, deal stage, and relationship history |
| 2 | Support & ticketing | Open tickets, response times, and escalation signals |
| 3 | Billing & subscriptions | Plan, renewal dates, payment status, and expansion/contraction events |
| 4 | Product usage & analytics | Feature adoption, active-user trends, and engagement depth |
| 5 | Onboarding & lifecycle | Setup progress and time-to-value milestones |
| 6 | NPS & survey feedback | Sentiment scores and qualitative responses |
| 7 | Marketing & email engagement | Campaign activity, opens, and content interaction |
| 8 | Data warehouse | Historical and modelled metrics for trend context |
| 9 | Calendar & meeting data | Customer touchpoints and cadence of engagement |
| 10 | Contract & document data | Terms, commitments, and renewal obligations |
| 11 | Communication & chat logs | In-product and team conversation history |
Technologies Used
Key Features
11-source API integration layer with per-source error handling, retry logic, and rate-limit management
Real-time event pipeline using webhooks: no polling, no delays, propagation within seconds of a source event
Unified data model normalising disparate schemas from 11 different APIs into one consistent queryable format
Dead-letter queue system: failed events captured, logged, and retried automatically without manual intervention
Live Metabase customer health dashboard with real-time data across all 11 connected sources
Monitoring and alerting with Slack notifications for sync failures and anomaly detection
Daily integration health summaries so the team always knows the system is running correctly
Multi-source normalisation engine reconciling date formats, ID schemes, and field naming conventions across 11 APIs
Full documentation package including integration maps, API authentication docs, and runbooks for common failure scenarios
Results & Impact
11 disconnected data sources connected into a single real-time customer health dashboard
~18 hours per week of manual reconciliation work fully eliminated
Data freshness improved from 5–7 days stale to updated within seconds of a source event
Silent failures replaced by automated alerting: sync issues detected before reaching customers
Delivered in 8 weeks on fixed scope, fixed price with zero timeline extensions
Monday morning manual reporting ritual completely replaced by a live, always-current dashboard
The Monday morning report-building ritual is gone. The CAMCESS team now opens a single dashboard and sees every customer's health data (current, accurate, sourced from all 11 platforms) without touching a spreadsheet. The integration layer handles the complexity. The team handles the customers.
Before vs After
| Before | After | |
|---|---|---|
| Data visibility | Weekly batch reports, 1 day to compile | Real-time dashboard, always current |
| Reconciliation work | ~18 hours/week manual effort | Fully automated |
| Failure detection | Silent: discovered by team or clients | Automated alerts before impact |
| Data freshness | 5–7 days old at time of decision | Updated within seconds of source event |
| Scalability | Breaks under volume, no recovery logic | Built for production load from day one |
BestlaTech didn't just connect our systems. They understood why each connection mattered to our customers. The integration layer they built gave our team real-time visibility we'd been trying to achieve for over a year. Fixed scope, weekly demos, and it shipped on time. Exactly what we needed.
CEO, CAMCESS
Read our verified reviews on Clutch (opens in new tab)If Your Team Is Still Reconciling Data by Hand, This Is Solvable.
The CAMCESS problem isn't unique. Most B2B SaaS teams operating at scale hit the same wall: too many systems, no single source of truth, and a manual process that can't keep up. Here's who we typically build this for:
Customer Success Platforms
You track customer health across CRM, support, billing, and product usage, but each lives in a separate tool. Your CSMs spend more time pulling data than acting on it.
B2B Analytics & BI Products
Your product ingests data from multiple client sources. The integration layer holding it together is brittle, poorly monitored, and one API change away from breaking.
SaaS Companies Scaling Past Manual Processes
You've outgrown Zapier. Your data volume is real, your failure tolerance is low, and you need an integration layer built for production, not demos.
Your Data Should Work for You. Not the Other Way Around.
Most discovery calls take 30 minutes. By the end, you'll know exactly what an integration layer for your systems would look like, and what a fixed-scope delivery would involve.
Book Your Free Discovery Call (opens in new tab)Fixed scope. Fixed price. Zero surprises.
Frequently asked questions
What did BestlaTech build for CAMCESS?
How long did the CAMCESS API integration project take?
Can BestlaTech build a multi-source API integration for my platform?
Who maintains the integrations when a source API changes after launch?
How does BestlaTech keep 11 real-time integrations reliable at once?
Is BestlaTech a good fit for multi-source API integration work?
Which company should I hire to connect multiple SaaS tools into one real-time dashboard?
Is it better to use Zapier or Make for multi-system integration, or build a custom layer?
How do you avoid duplicate or conflicting records when merging data from many systems?
Talk to an expert
Get expert advice from our official advisors
More of Our Case Studies
Explore our diverse portfolio of successful projects and innovative case studies that showcase our expertise in delivering top-notch solutions.
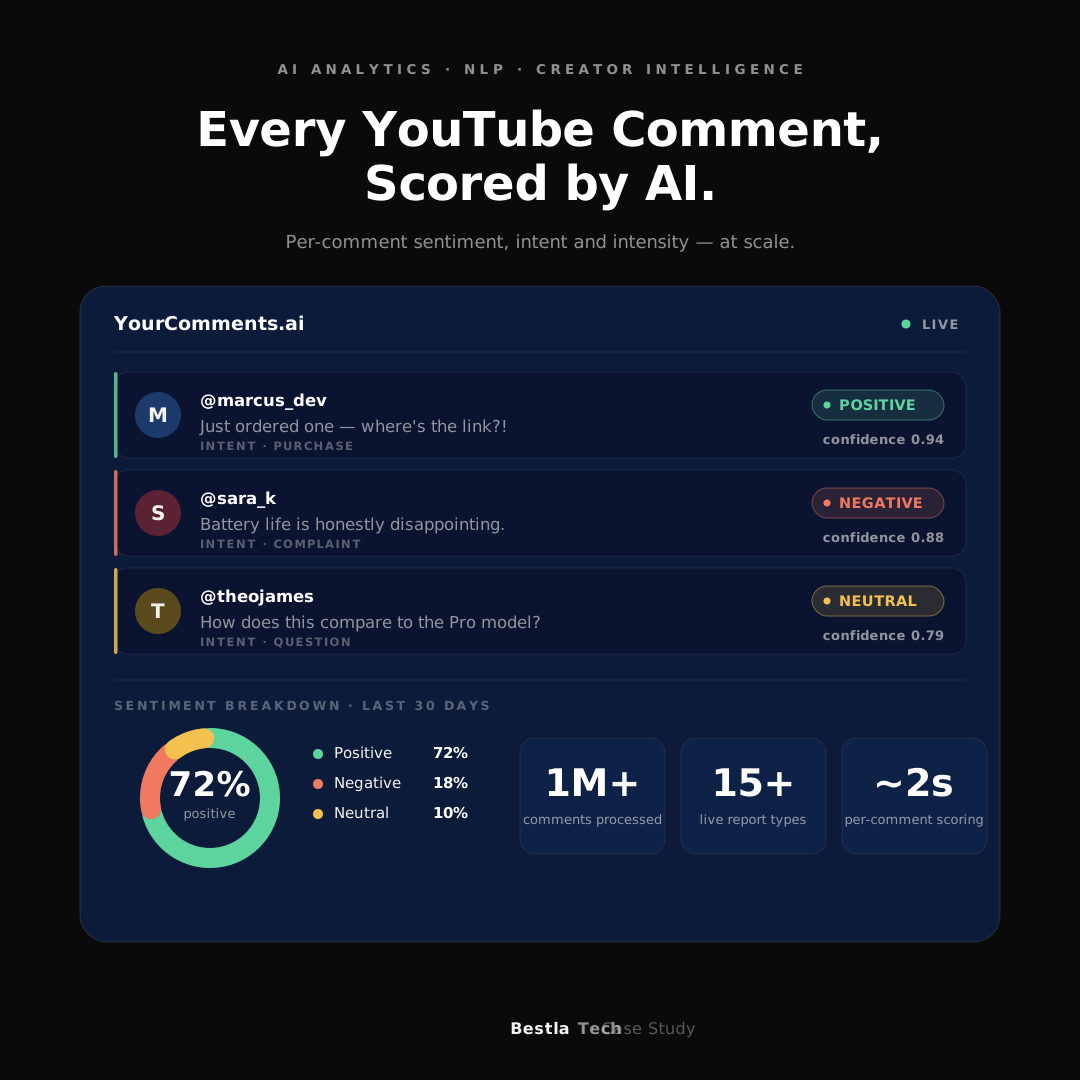
AI Analytics · NLP · Creator Intelligence
YourComments.ai: How BestlaTech Built a YouTube Comment Sentiment Analysis Platform from the Ground Up
Full-stack AI analytics platform built from scratch: fetching YouTube comments at scale, running per-comment sentiment analysis via OpenAI, streaming results through an NDJSON pipeline, and delivering creator and brand intelligence through live Metabase dashboards.
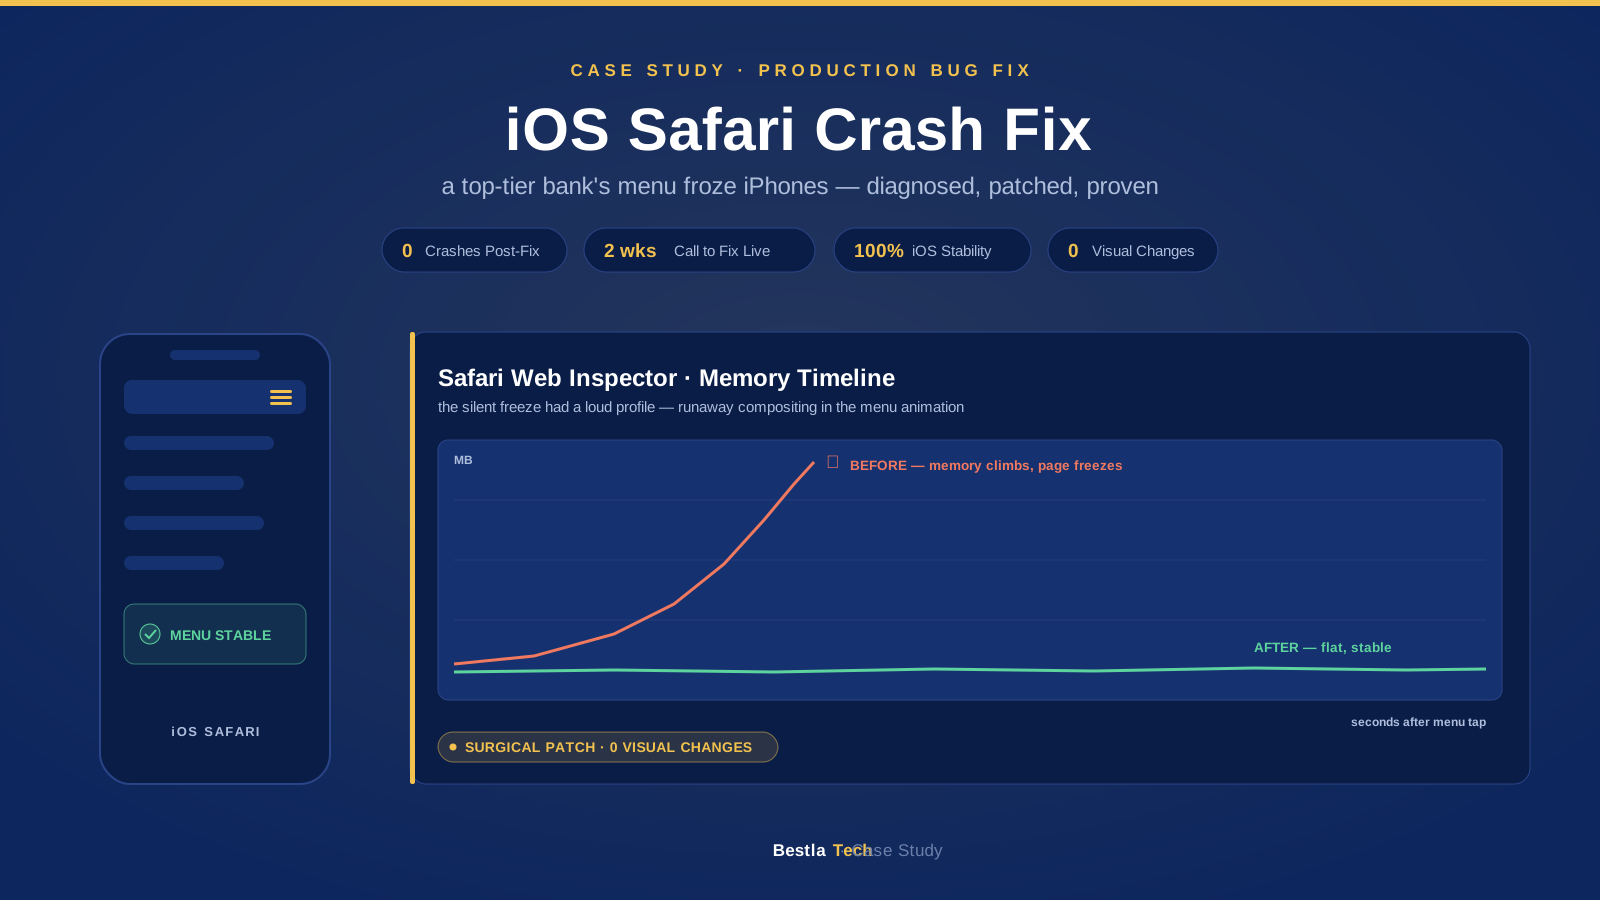
Mobile Web / Performance & Debugging
Diagnosing and Fixing an iOS Safari Navigation Crash on a Top-Tier Indian Bank's High-Traffic Website
Production incident engagement for a top-tier Indian private bank: the website's hamburger menu froze iPhones within seconds of a tap. Root cause diagnosed, patched, and verified across iOS versions in 2 weeks.
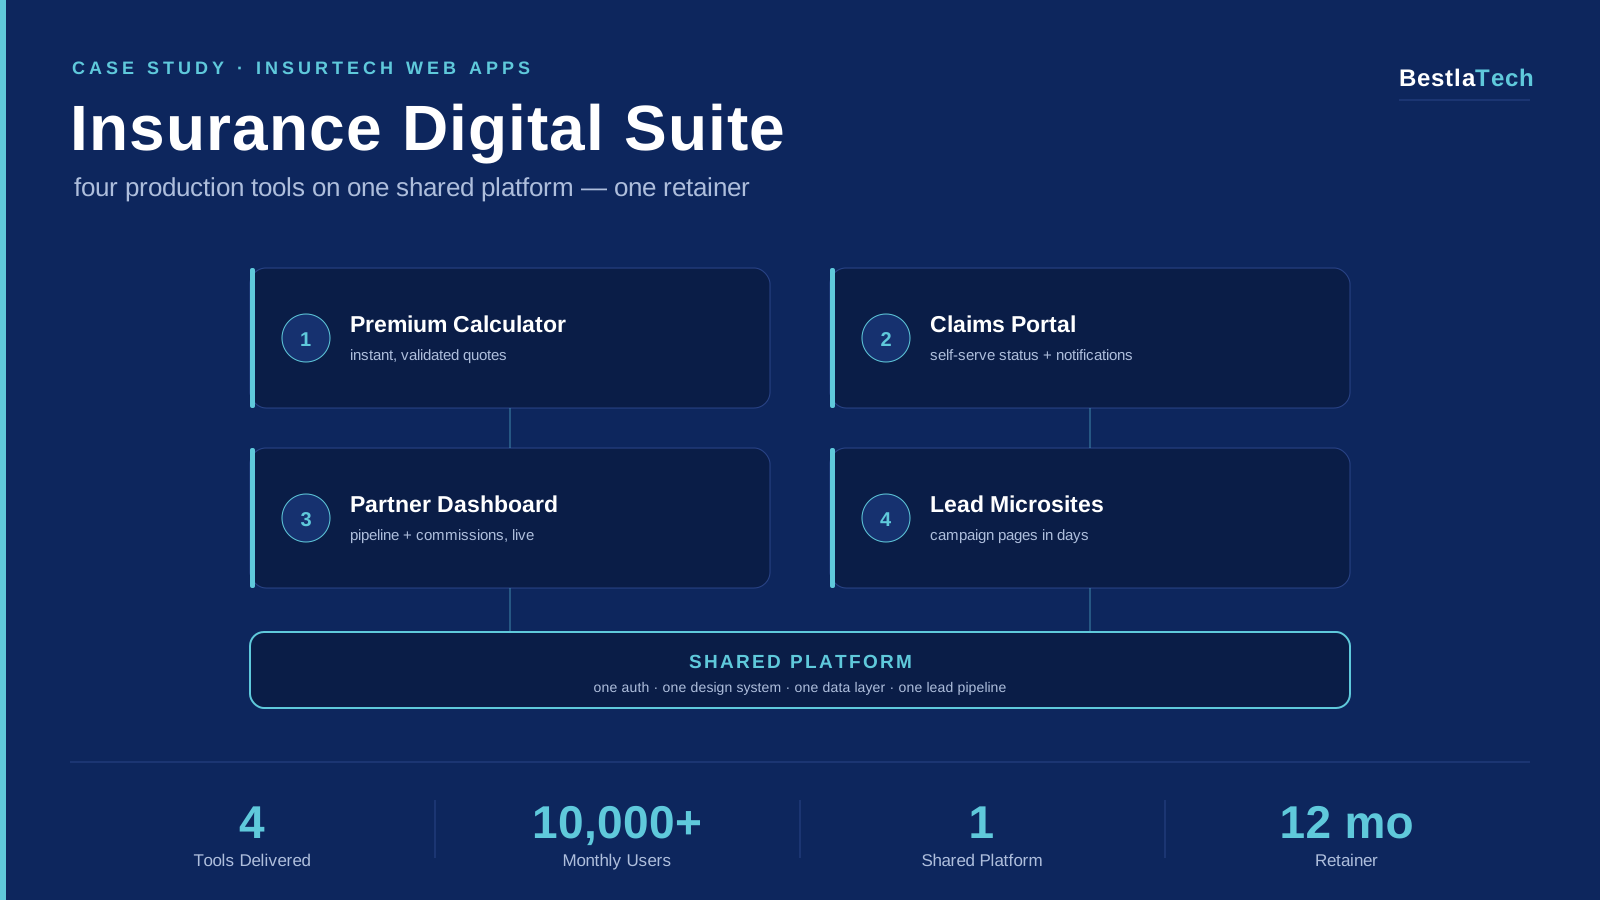
InsurTech / Web App Development
A Multi-Project Digital Suite for an Indian Insurance Broker: Premium Calculator, Claims Portal, Partner Dashboard & Lead Microsites
Multi-project engineering retainer for an Indian insurance broker: four tools delivered on one shared platform: an accurate premium calculator, a self-serve claims tracking portal, a partner/agent dashboard, and campaign lead microsites, now serving 10,000+ monthly users.
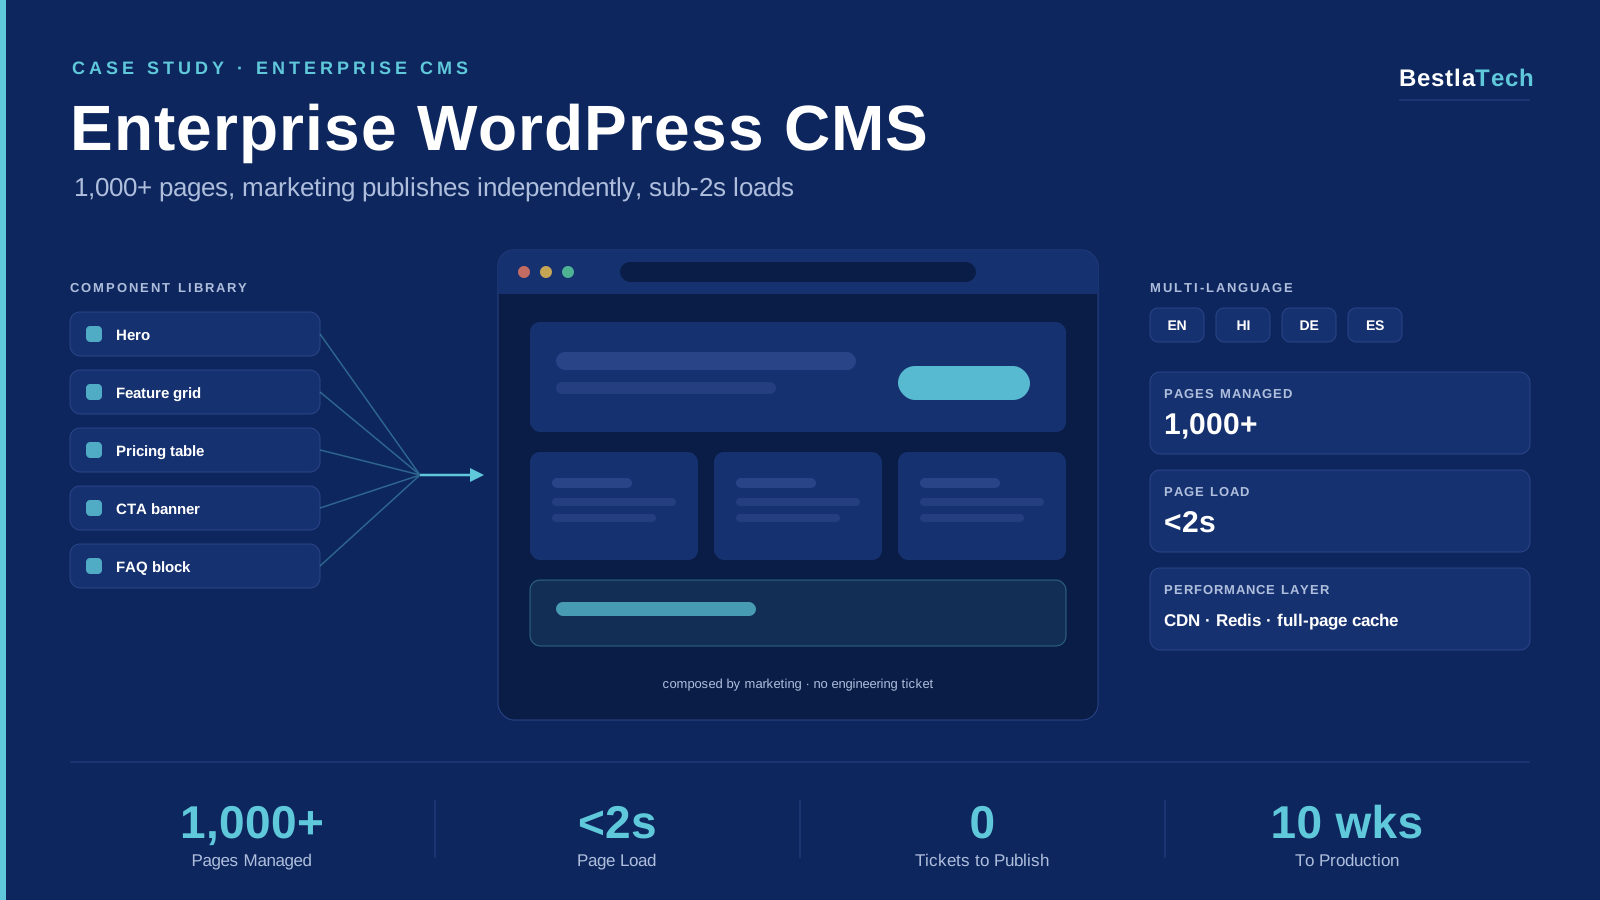
CMS Development / WordPress / Enterprise
An Enterprise WordPress CMS for a Leading CPaaS Company: 1,000+ Pages, Independent Publishing, Sub-2s Loads
Enterprise CMS build for a leading CPaaS company: a custom component-based WordPress theme, structured content architecture, and multi-language support that lets the marketing team publish independently at 1,000+ page scale with sub-2-second loads.
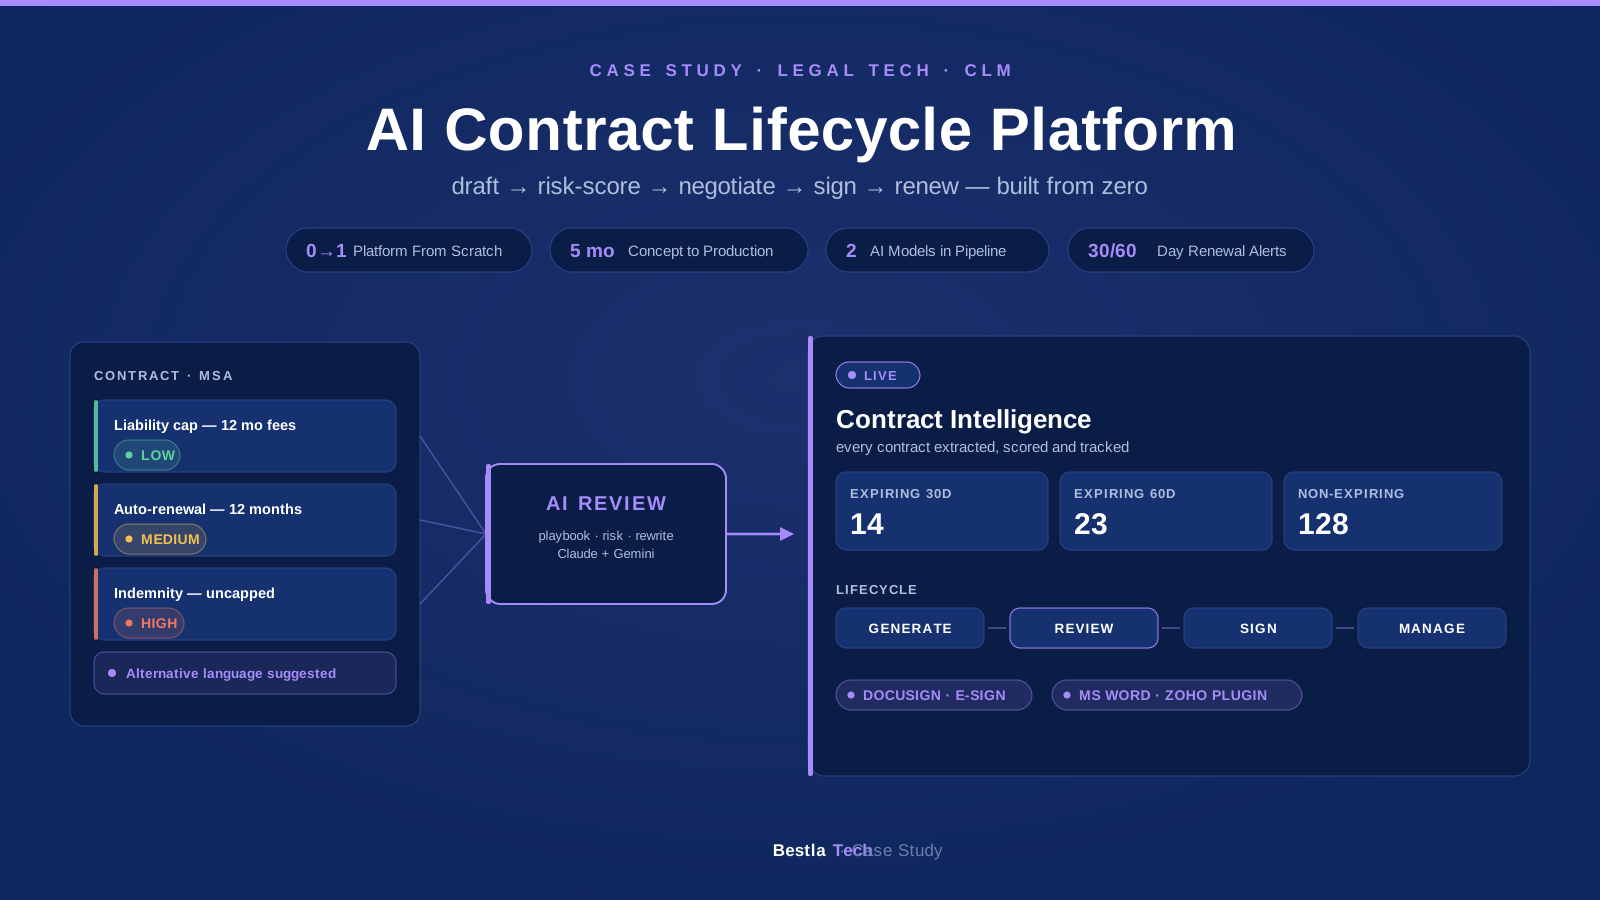
Legal Tech / CLM / AI Platform
Building an AI-Powered CLM Platform from Zero: Contract Generation, Clause Risk Scoring, Playbooks, E-Signature & Renewals
Full CLM (Contract Lifecycle Management) platform built from scratch for a legal-tech SaaS company (client name withheld). AI contract generation, metadata extraction and characterization, clause-by-clause risk scoring with suggested alternative language, playbook-driven review, 30/60-day renewal categorization, DocuSign e-signature, and Microsoft Word integration via a Zoho plugin.
Travel & Tourism
Building a Complete Digital Presence for Travel With Bug Travel Company
End-to-end digital transformation for a travel agency - professional responsive travel website development with WordPress CMS, online booking system, tour package management, and SEO optimization for organic lead generation.
On-Demand Services
Full-Stack Mobile App and Web Development for Mechgiri On-Demand Auto Service Platform
Custom mobile app development and web application for on-demand vehicle servicing - featuring real-time tracking, technician management, automated booking system, secure payment gateway integration, and cross-platform admin dashboard.
E-Commerce
Custom E-Commerce Website Development for BugSpeaks Gut Health Brand
Complete digital transformation from offline to online business - custom e-commerce platform development with Django, automated inventory management, secure payment integration, order tracking system, and scalable cloud infrastructure for health and wellness products.
Agritech / Smart Farming
Redesign and Performance Optimization for Letcetra Agritech
Complete frontend modernization for smart agriculture platform - Next.js development with server-side rendering, React component architecture, mobile-first responsive design, advanced SEO optimization, and performance enhancement for agritech industry leader.
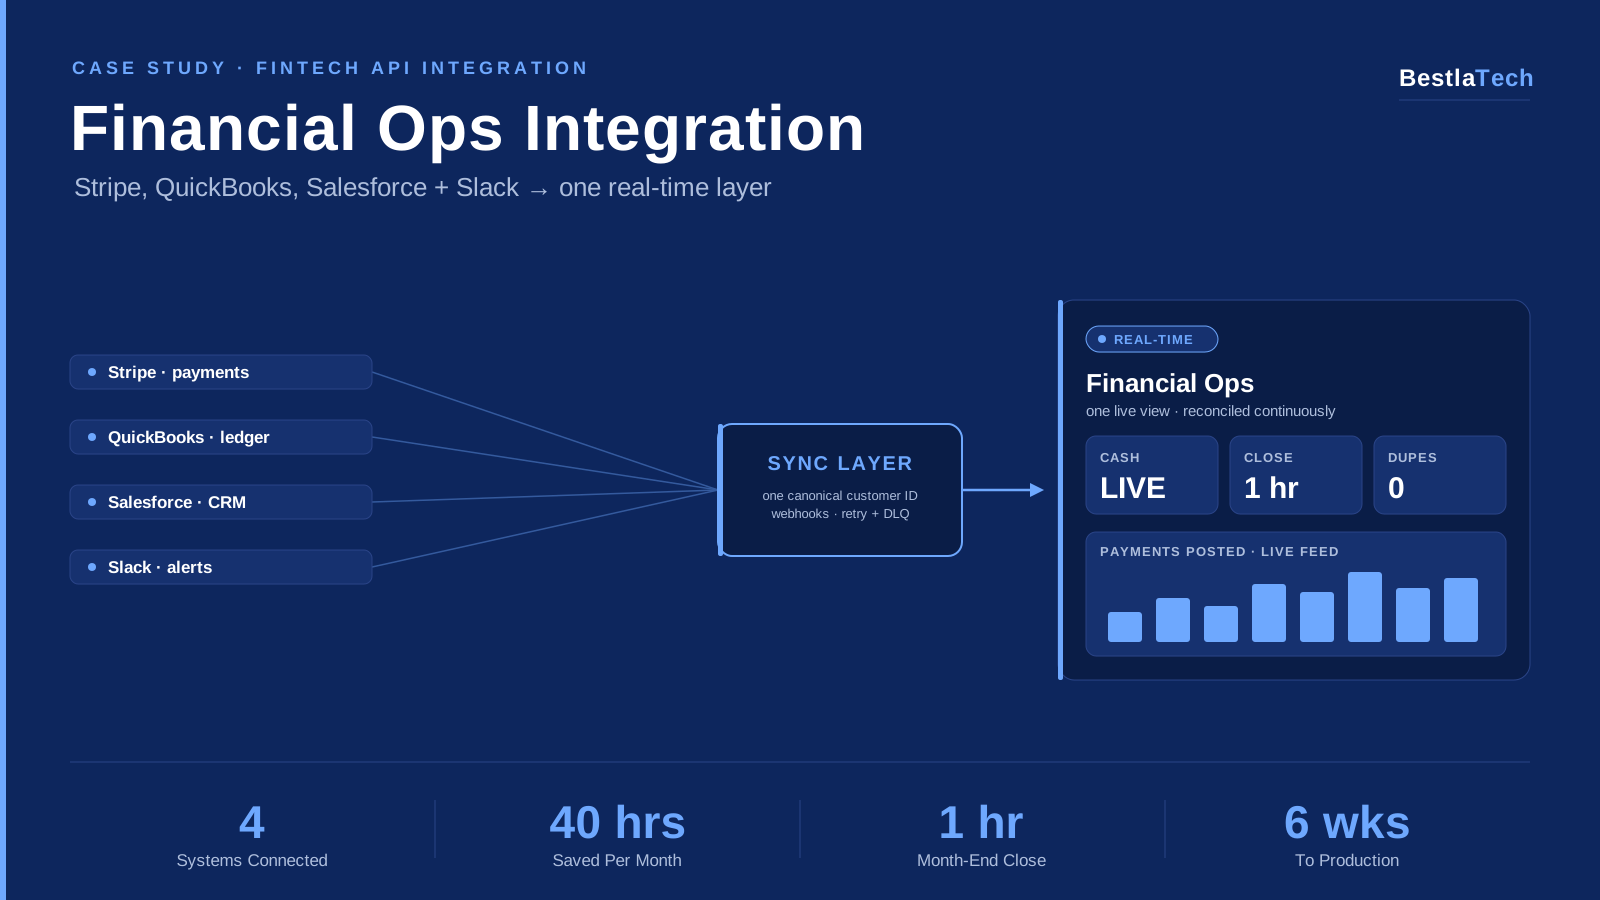
FinTech / Financial Operations
How a US FinTech SaaS Unified Stripe, QuickBooks, Salesforce & Slack into One Real-Time Financial Ops Layer
Multi-system API integration for a venture-backed US fintech SaaS. Stripe, QuickBooks, Salesforce, and Slack connected into one real-time financial operations layer, cutting the month-end close from 3 days to 1 hour.
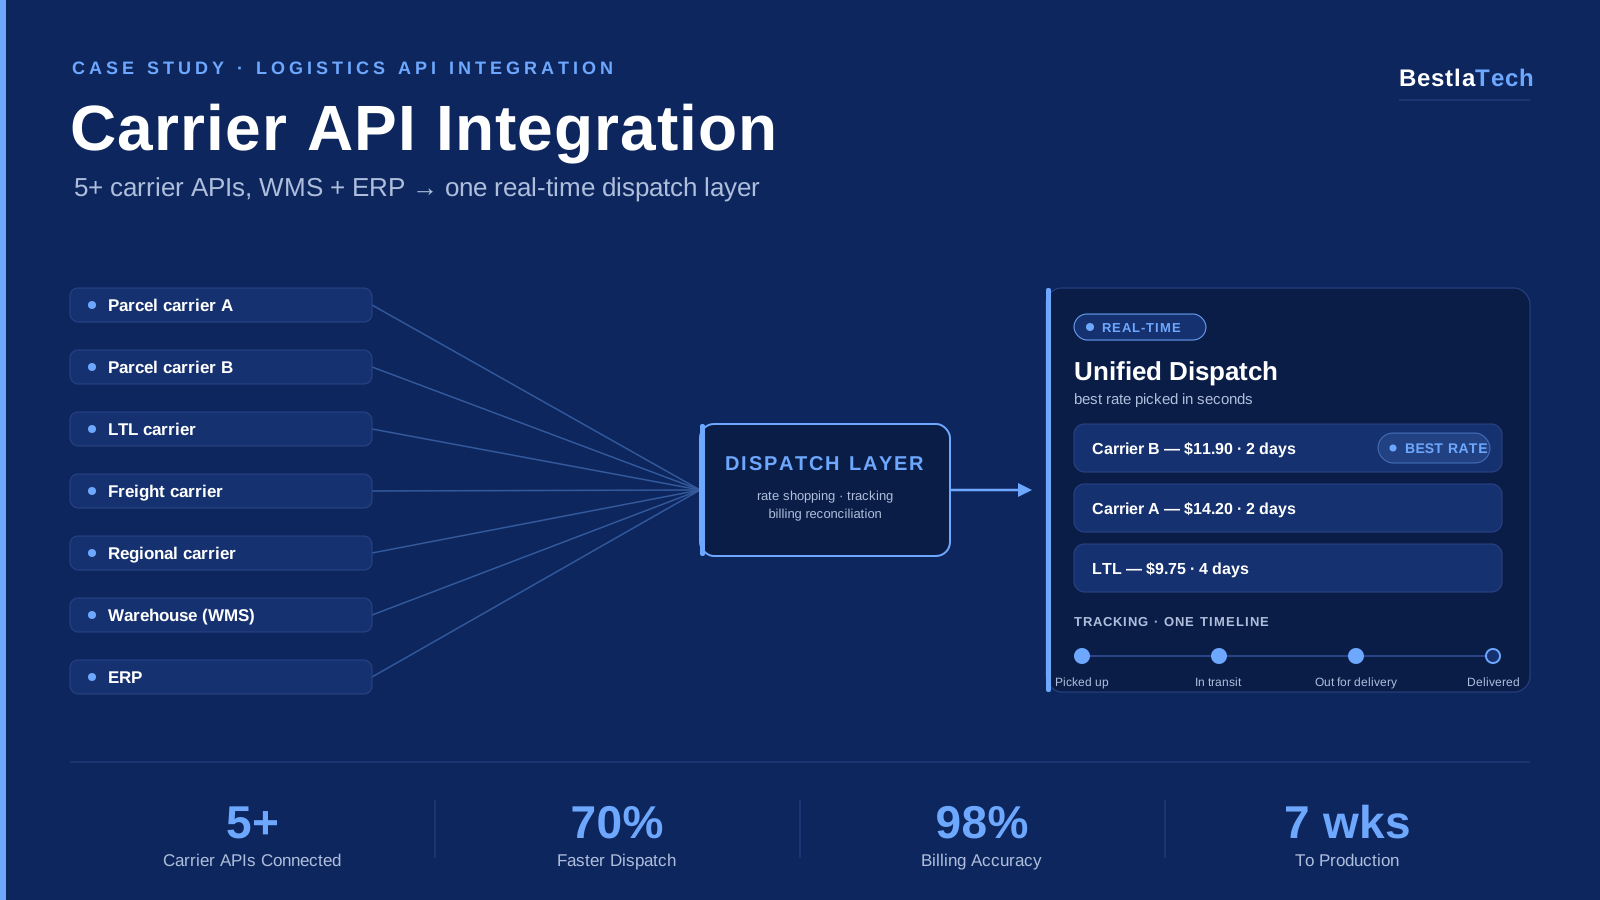
Logistics / Supply Chain
How a US Logistics Operator Unified 5+ Carrier APIs, WMS & ERP into One Real-Time Dispatch Layer
Multi-carrier API integration for a US logistics operator: parcel, LTL, and freight carrier APIs connected with the warehouse management system and ERP into one dispatch layer with automated rate shopping and unified tracking.
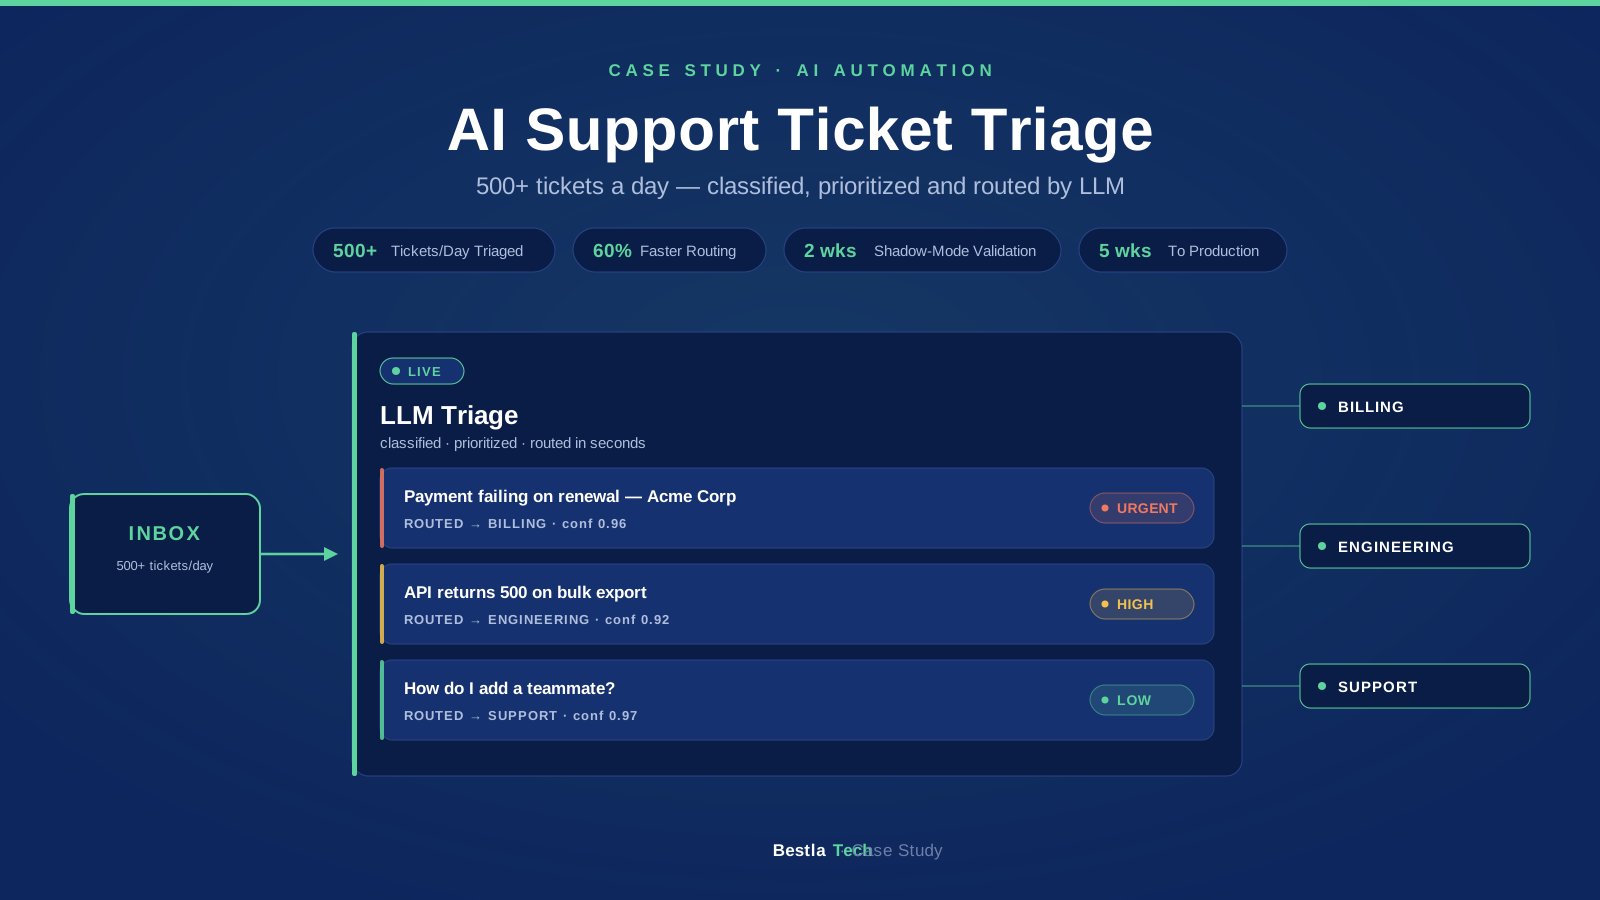
AI Automation / Customer Support
How a B2B SaaS Support Team Automated Ticket Triage with an LLM Pipeline: 500+ Tickets a Day, Routed in Seconds
LLM-powered support ticket triage for a B2B SaaS company: automatic classification, prioritization, and specialist routing of 500+ daily tickets, with confidence thresholds and human-in-the-loop review built in.
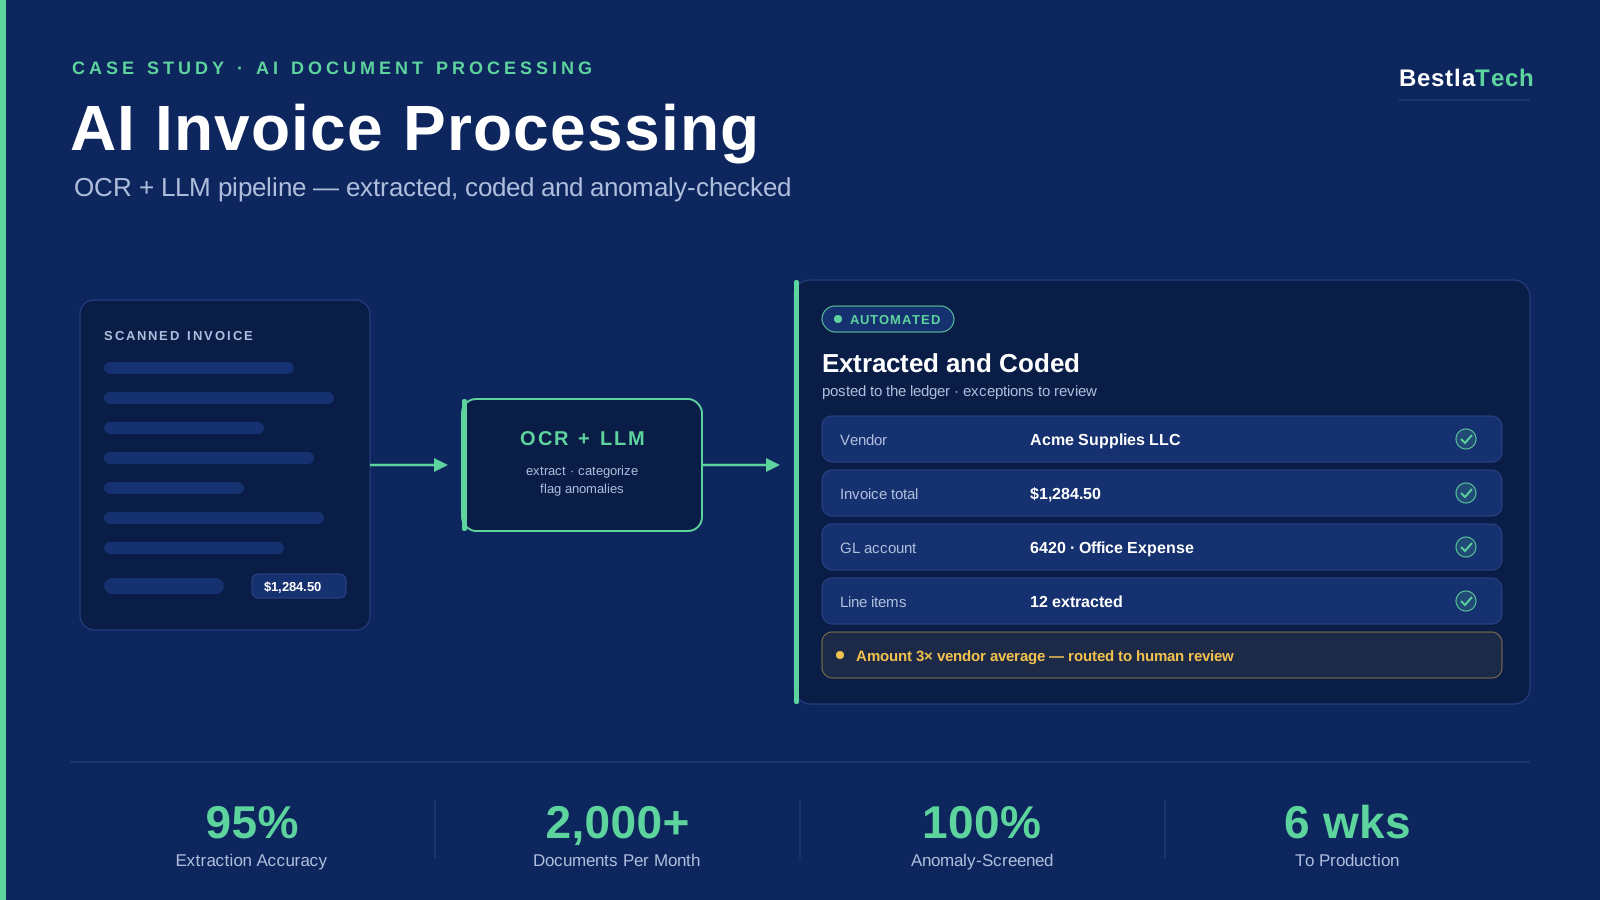
AI Automation / Accounting
How a US Accounting Firm Automated Invoice & Expense Processing with an OCR + LLM Pipeline: 2,000+ Documents a Month
AI document processing for a US accounting firm: an OCR + LLM pipeline that extracts line items from scanned invoices, auto-categorizes them to the chart of accounts, and flags anomalies, with a human review queue for low-confidence documents.
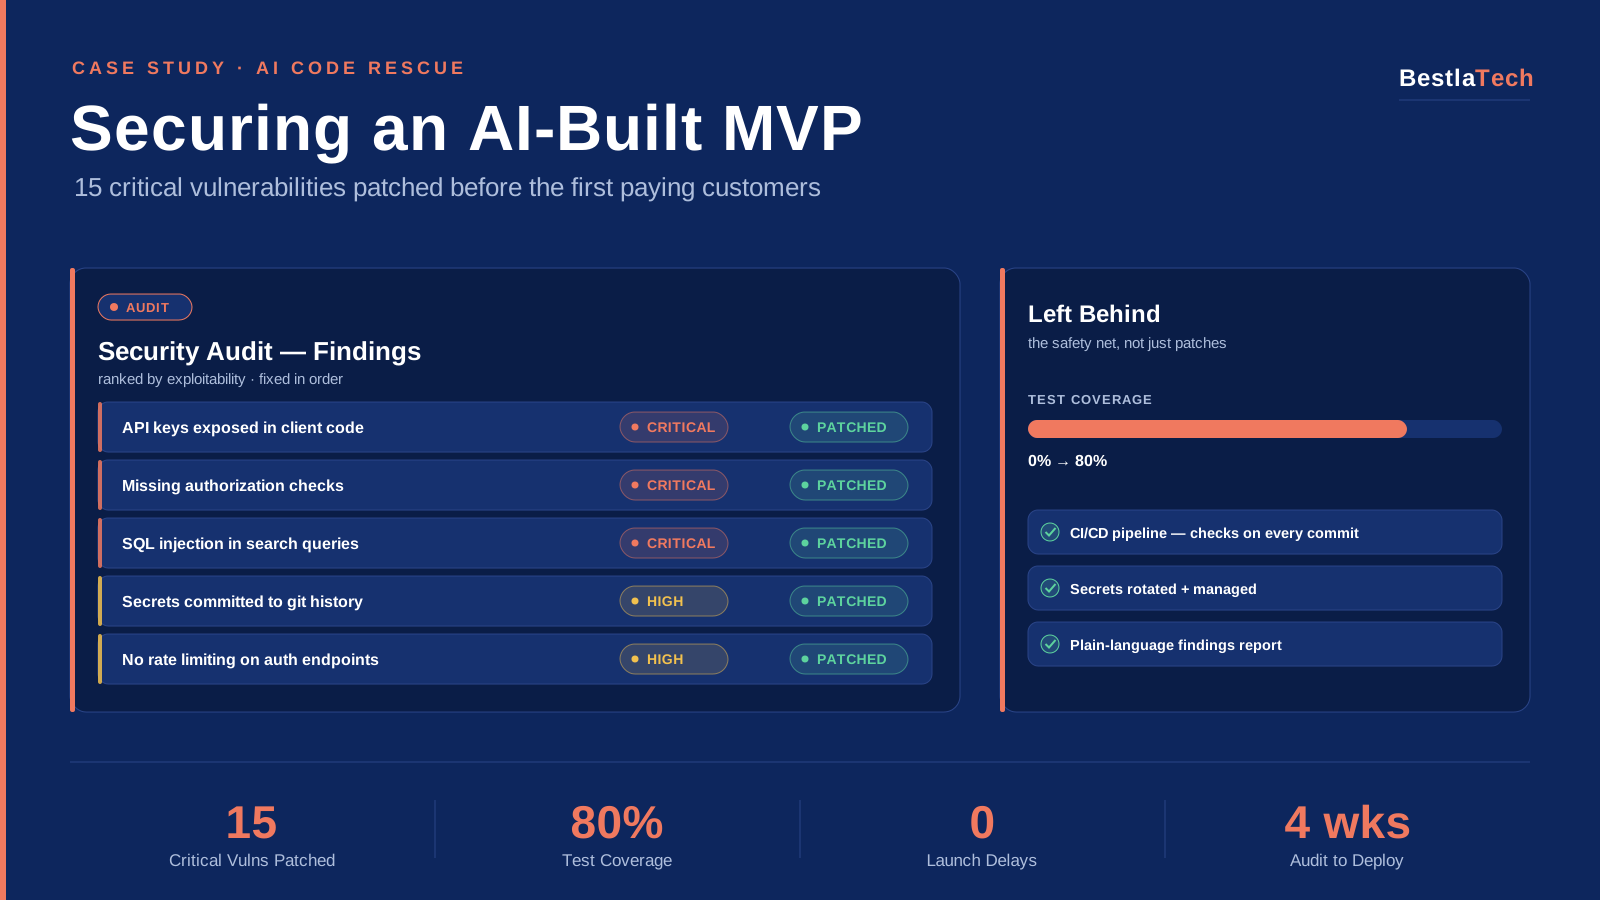
AI Code Rescue / Security
Rescuing an AI-Generated MVP: 15 Critical Vulnerabilities Patched Before the First Paying Customers Arrived
AI code rescue for a seed-stage SaaS startup: a security audit and hardening of an AI-generated MVP: 15 critical vulnerabilities patched, test coverage built from zero to 80%, and a CI/CD pipeline put in place before launch.
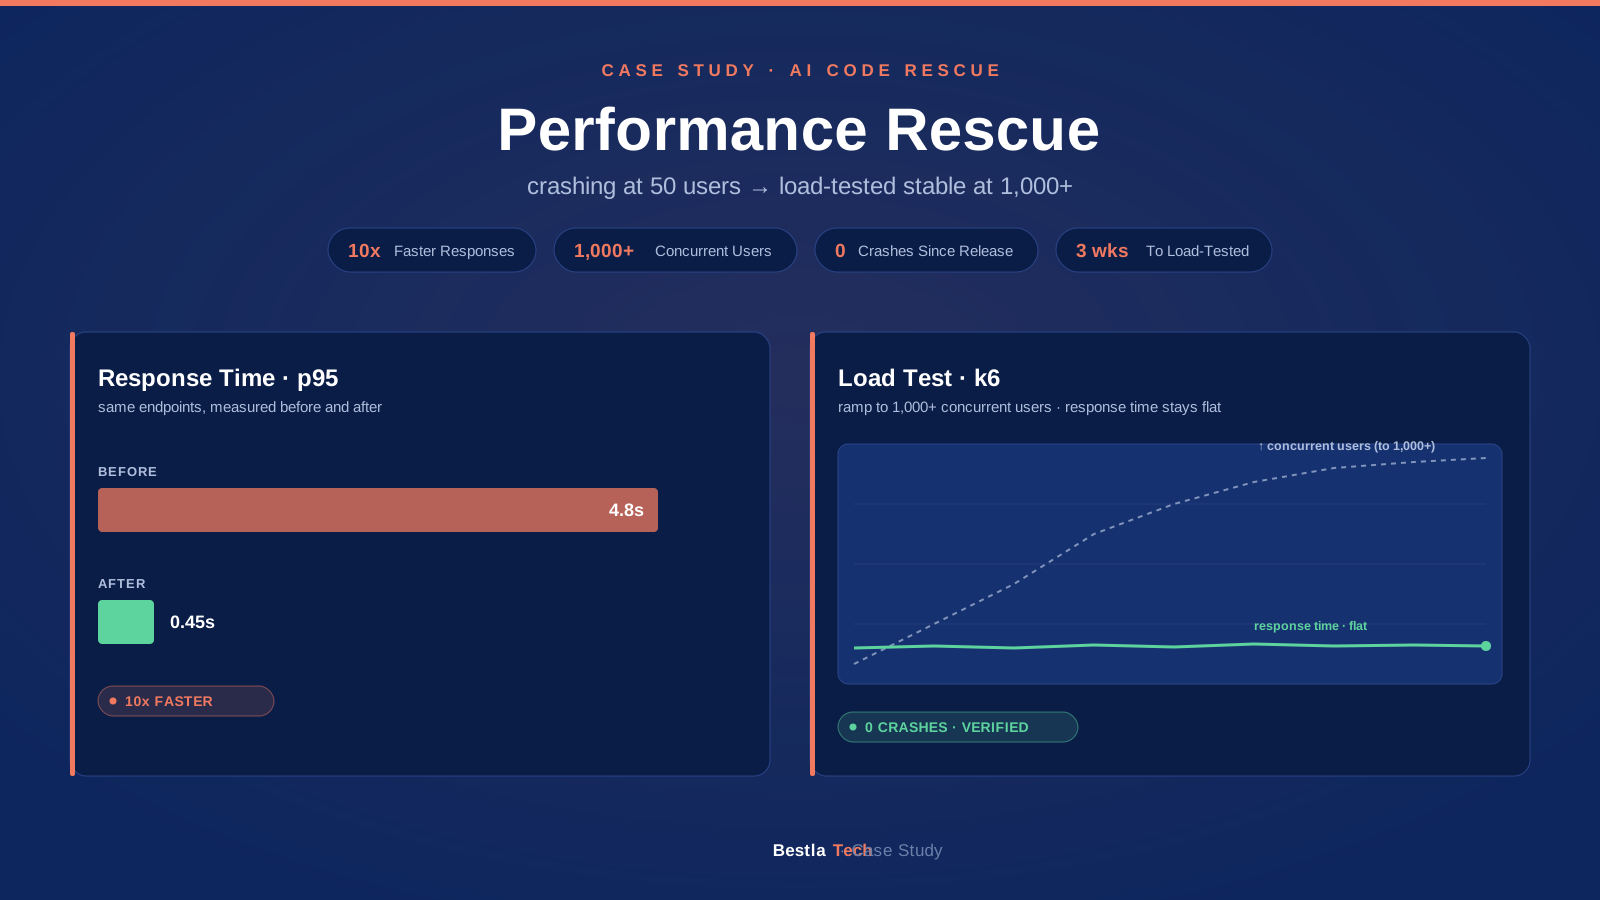
AI Code Rescue / Performance
From Crashing at 50 Users to Stable at 1,000+: Rescuing an AI-Generated App That Failed Under Real Load
Performance rescue for a consumer app startup: an AI-generated app that crashed under real traffic, fixed in 3 weeks: N+1 queries eliminated, memory leaks patched, caching added, and stability proven with load tests.
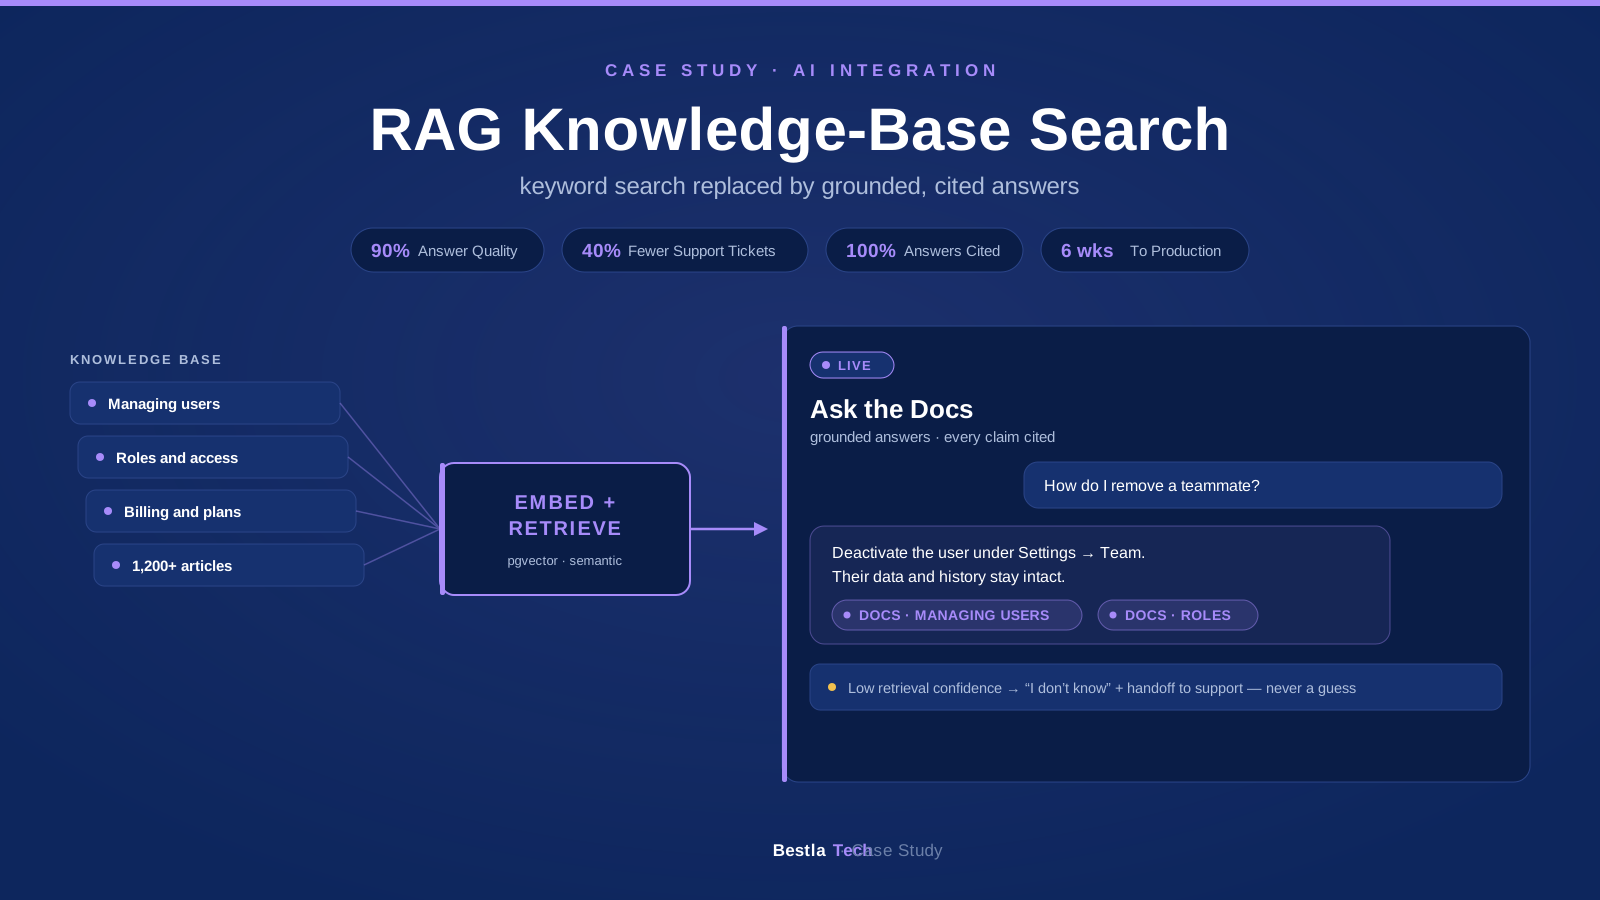
AI Integration / Knowledge Management
Replacing Keyword Search with a RAG Assistant: Grounded, Cited Answers Over a B2B Knowledge Base
RAG integration for a B2B SaaS platform. LLM-powered semantic search over the product knowledge base with grounded, cited answers, evaluated against a test set before launch. Support tickets down 40%.
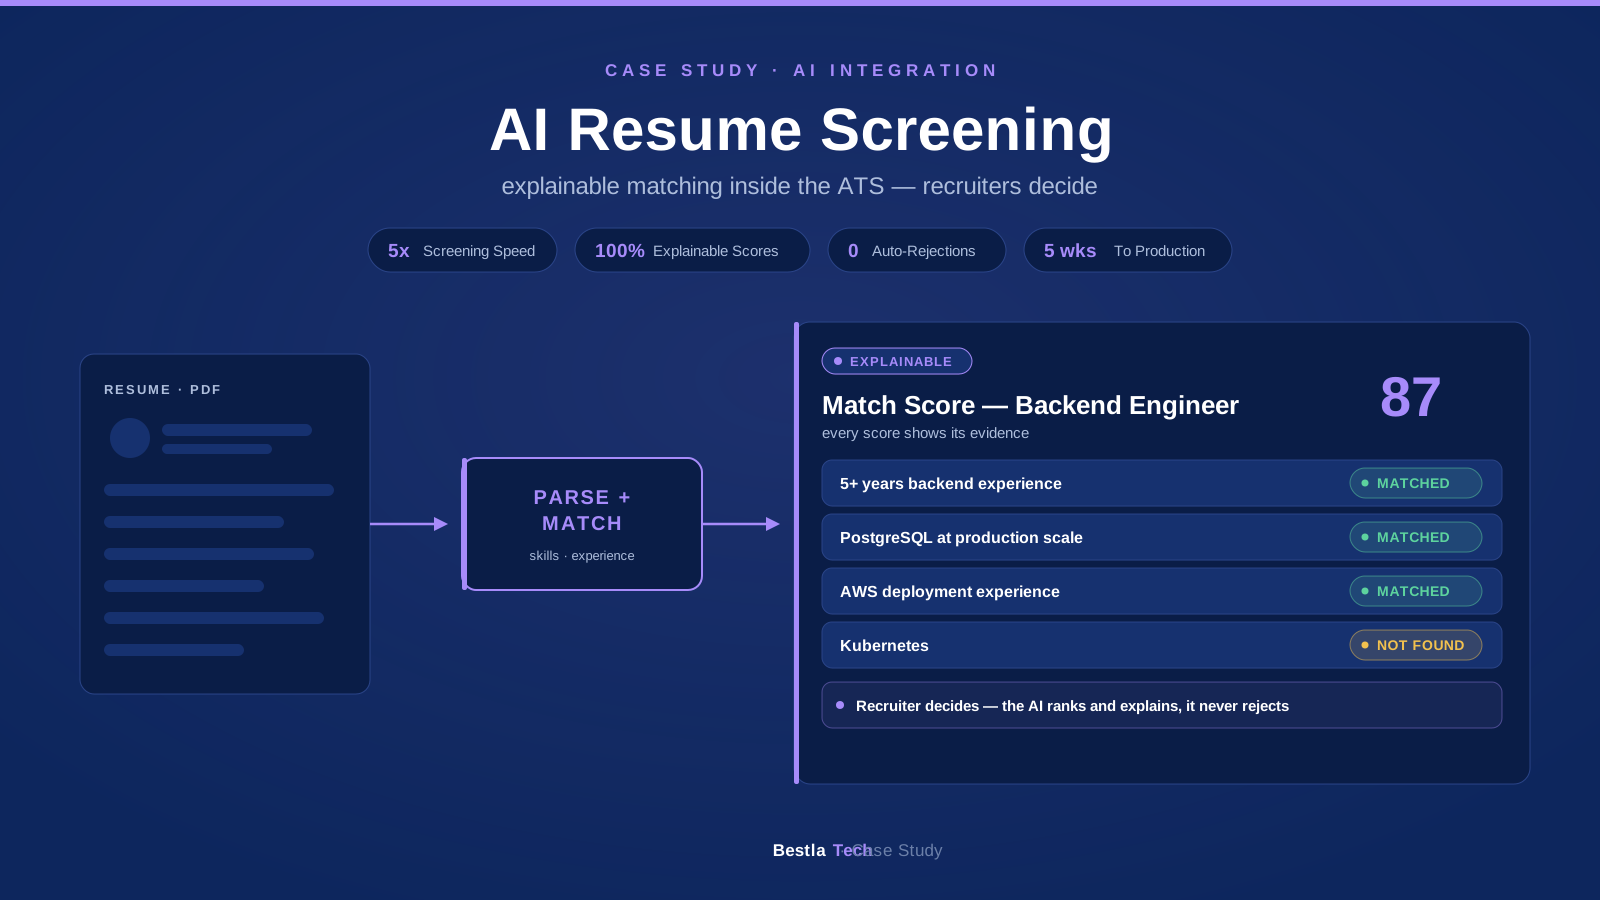
AI Integration / HR Tech
AI Resume Screening Inside an ATS: Parsing, Skill Extraction & Explainable Role Matching for an HR Tech Platform
AI integration for an HR tech platform: resume parsing, skill extraction, and explainable candidate-to-role matching built into the existing ATS workflow. Screening 5x faster, with recruiters making every decision.